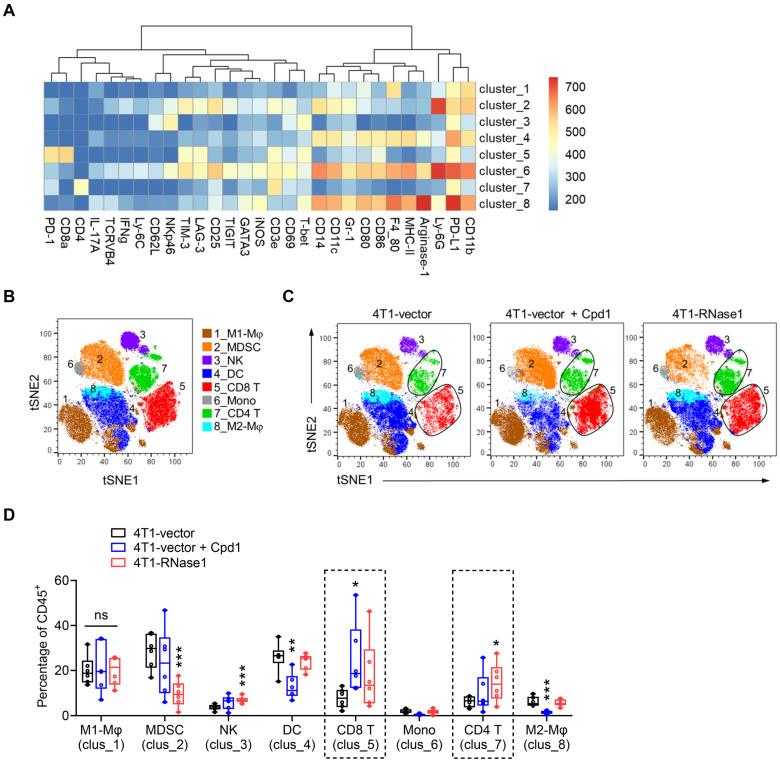
Figure 2.
Mice expressing RNase1 favor an antitumor TME. (A) A heatmap of different marker intensities in CD45+ tumor-infiltrating immune cell clusters identified by CyTOF data analysis using t-SNE and FlowSOM. (B and C) Annotation of t-SNE plots of immune cells overlaid with color-coded clusters based on marker expression as shown in (A). Mφ, macrophage; MDSC, myeloid-derived suppressor cell; NK, natural killer cell; DC, dendritic cell; CD8 T, CD8+ T cell; Mono, monocytes; CD4 T, CD4+ T cell. (D) Box plots of frequency of CD45+ tumor-infiltrating immune cell clusters as indicated. n = 6 mice per group. Box plots indicate minima (lower end of whisker), maxima (upper end of whisker), median (center), 25th percentile (bottom of box), and 75th percentile (top of box). *p < 0.05, **p < 0.01, ***p < 0.001, individually compared with the percentage at the first bar of each cluster (4T1-vector), one-tailed unpaired t test.

