Figure 4.
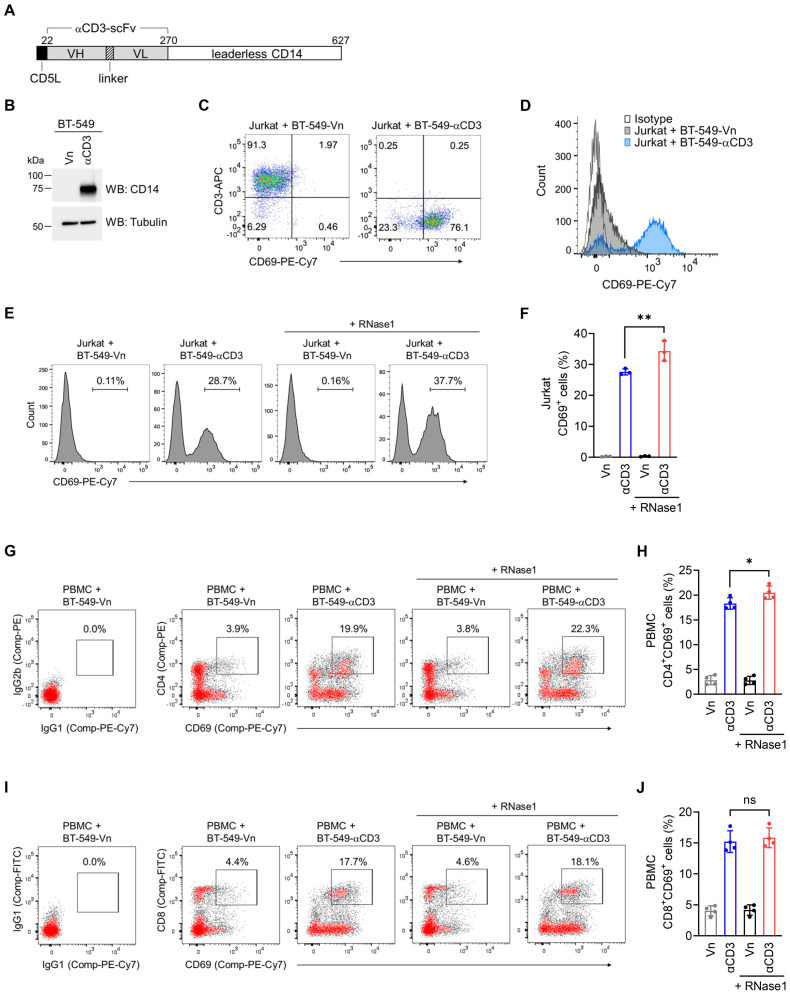
RNase1 boosts CD4+ T cell activation. (A) Schematic illustration of expression construct encoding anti-CD3 antibody single-chain fragment variable (αCD3-scFv) fused to the transmembrane domain of CD14. The numbers represent amino-acid residues. CD5L, CD5 leader; VH, variable domain of the heavy chain; VL, variable domain of the light chain. (B) Western blotting of the indicated stable cells with antibodies against CD14 and tubulin as loading control. The experiment was repeated a second time with similar results. (C) Flow cytometric analysis of CD69 and CD3 expression in the indicated BT-549 stable clones cocultured with Jurkat cells for 2 days. (D) Flow cytometric analysis of CD69 expression in the indicated BT-549 stable clones cocultured with Jurkat cells for 2 days. IgG isotype control was performed in the BT-549-Vn cocultured with Jurkat cells. (E and F) Representative flow cytometric images (E) and quantitative analysis (F) of CD69 expression in the indicated BT-549 stable clones cocultured with Jurkat cells combined with or without RNase1 treatment (1 μg/ml) for 24 h. (G-J) Representative flow cytometric images and quantitative analysis of the expression of CD69 and CD4 (G and H) or CD69 and CD8 (I and J) in the indicated BT-549 stable clones cocultured with human PBMCs combined with or without RNase1 treatment (1 μg/ml) for 24 h. IgG isotype control, left panel. Data represent the mean ± SD of three independent experiments. *p < 0.05, **p < 0.01, ns, not significant, two-tailed unpaired t test.

