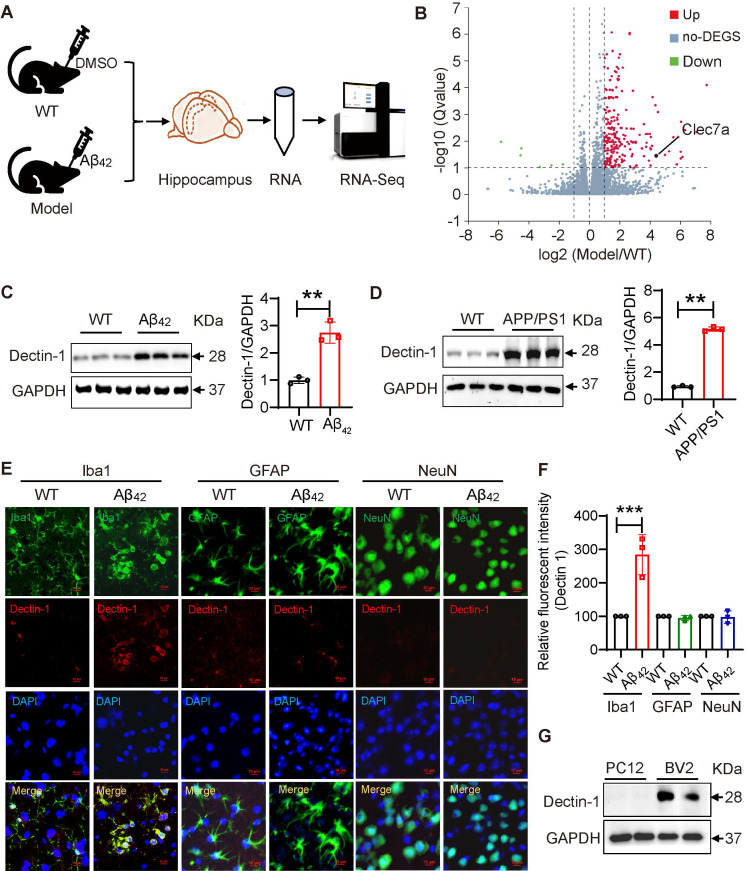
Figure 1.
Dectin-1 is up-regulated in AD model mice. (A) RNA-seq analyses using hippocampus from the brains of C57 following DMSO infusion or C57 following Aβ42 infusion for two weeks. N=6, 3 mice per group. (B) Bioinformatic analysis of RNA-seq. (C) Protein levels of Dectin-1 in the hippocampal tissue following Aβ42 infusion. (D) Protein levels of Dectin-1 in the hippocampal tissues of APP/PS1 mice. (E) Representative dual-immunofluorescence staining of Microglia marker Iba1 (green), Astrocyte marker GFAP (green), Neuron Marker (NeuN) and Dectin-1 (red) in the hippocampal tissue of Aβ42 infused mice. Sections were counterstained with DAPI (blue) [scale bar = 10 μm]. (F) Quantification analysis of Dectin-1 in E. (G) Western blot level of Dectin-1 in mouse bone marrow-derived macrophages (PC12), microglia cell line (BV2).

