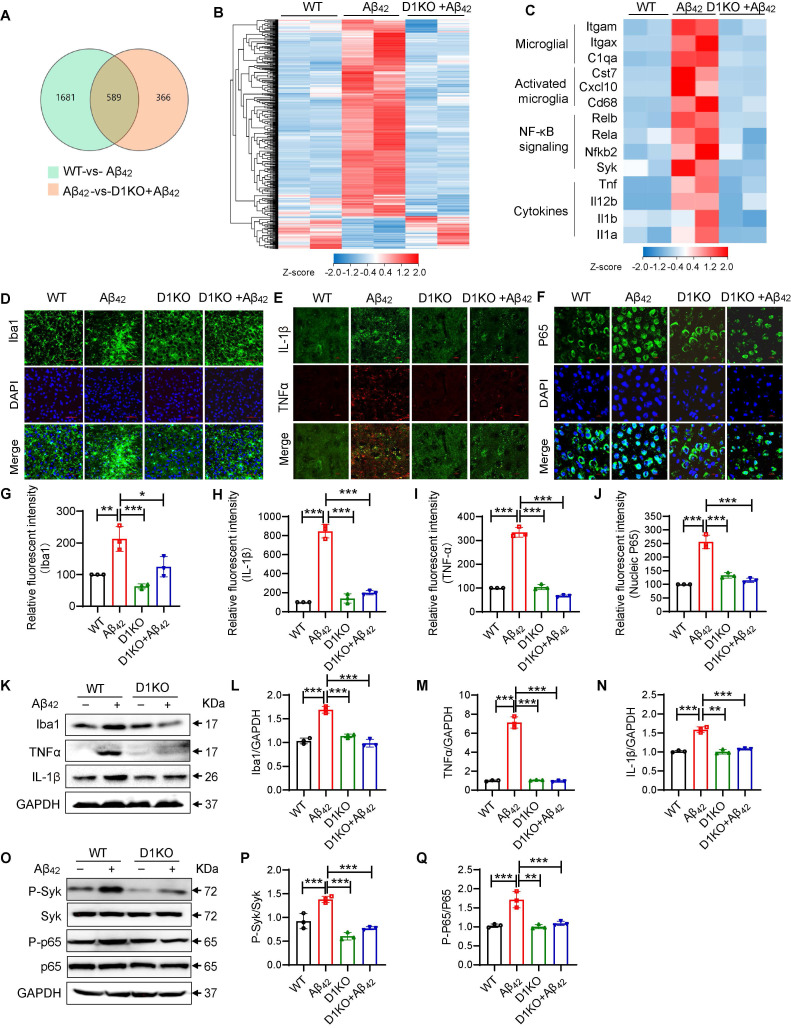
Figure 4.
Dectin-1 mediates microglia activation and inflammatory response in brain tissue. (A) Venn diagram depicting expressed genes in WT-vs- Aβ42 and D1KO-vs- Aβ42. (B) Heatmap shows four groups of expressed genes that expressed differentially between 8-week-old WT, Aβ42, D1KO, and D1KO+ Aβ42 mice (P < 0.05). (C) Heatmap of microglia markers, markers in activated microglia, NF-κB signaling, and cytokines from these four groups of mice. (D) Representative immunofluorescence staining of Iba1(green) in brain tissues of WT and Model (Aβ42 infusion) mice. Sections were counterstained with DAPI (blue) [scale bar = 50 μm]. (E) Representative double-immunofluorescence staining of TNFα (red) and IL-1β (green). Slides were counterstained with DAPI (blue) [scale bar = 10 μm]. (F) Representative immunofluorescence staining of NFκB (green) in brain tissues of WT and Aβ42 infusion mice. Sections were counterstained with DAPI (blue) [scale bar = 10 μm]. (G) Quantification of Iba1 staining in D. (H-I) Quantification of IL-1β and TNFα staining in E. (J) Quantification of NFκB staining in F. (K-N) Representative western blot analysis of Iba1, TNFα, and IL-1β in hippocampus tissue lysates. (O-Q) Representative western blot analysis of p-Syk, Syk, P-NFκB65, and NFκB65 in mouse brain tissue lysates.

