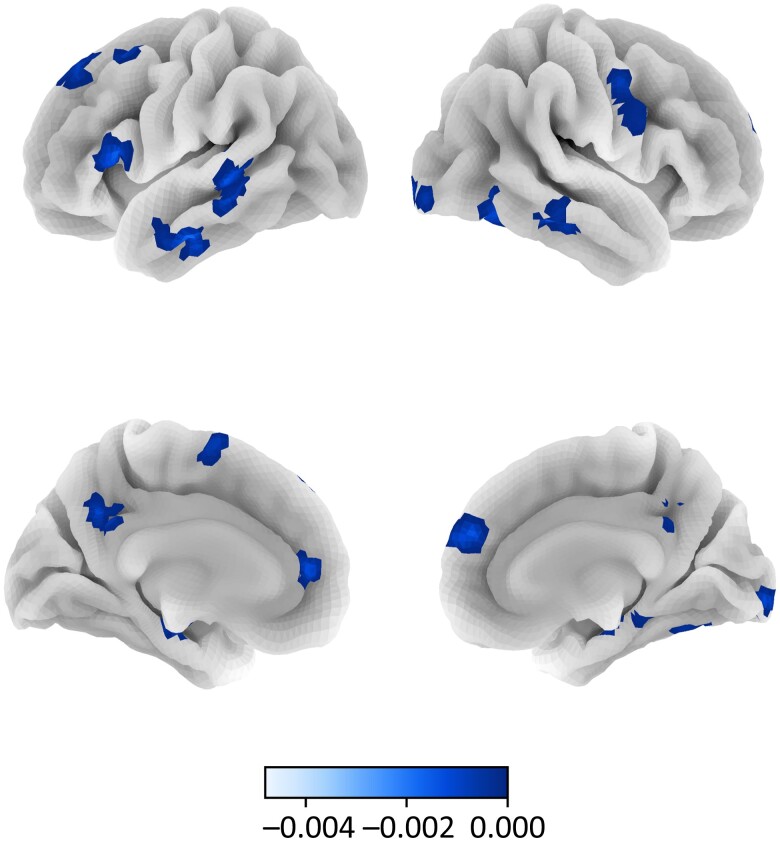
Fig. 5.
Regions in which altruists exhibited a different relationship between neural activation and social valuation in contrast to all controls. Note. Colormap corresponds to the difference in subjective social value-related activity (FDR-corrected q < 0.05) between altruists and controls. Surface corresponds to the following key: left lateral = top left; right lateral = top right; left medial = bottom left; right medial = bottom right.

