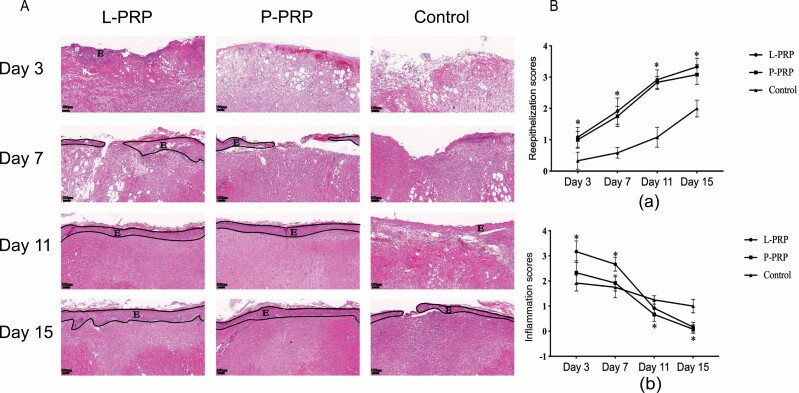
Figure 3.
The analyses of histological change on wounds. A. Samples were subjected to H&E staining. Representative images on the central surface of skin tissues in the wound are shown. E represents the epidermis layer. B. Relative semiquantitative scores of the three groups at four different time points. Re-epithelialization scores is shown in picture (a), and inflammation scores in (b). * represents P < .05 for PRP groups compared to the control group. PRP, platelet-rich plasma.

