
FIGURE 6 |.
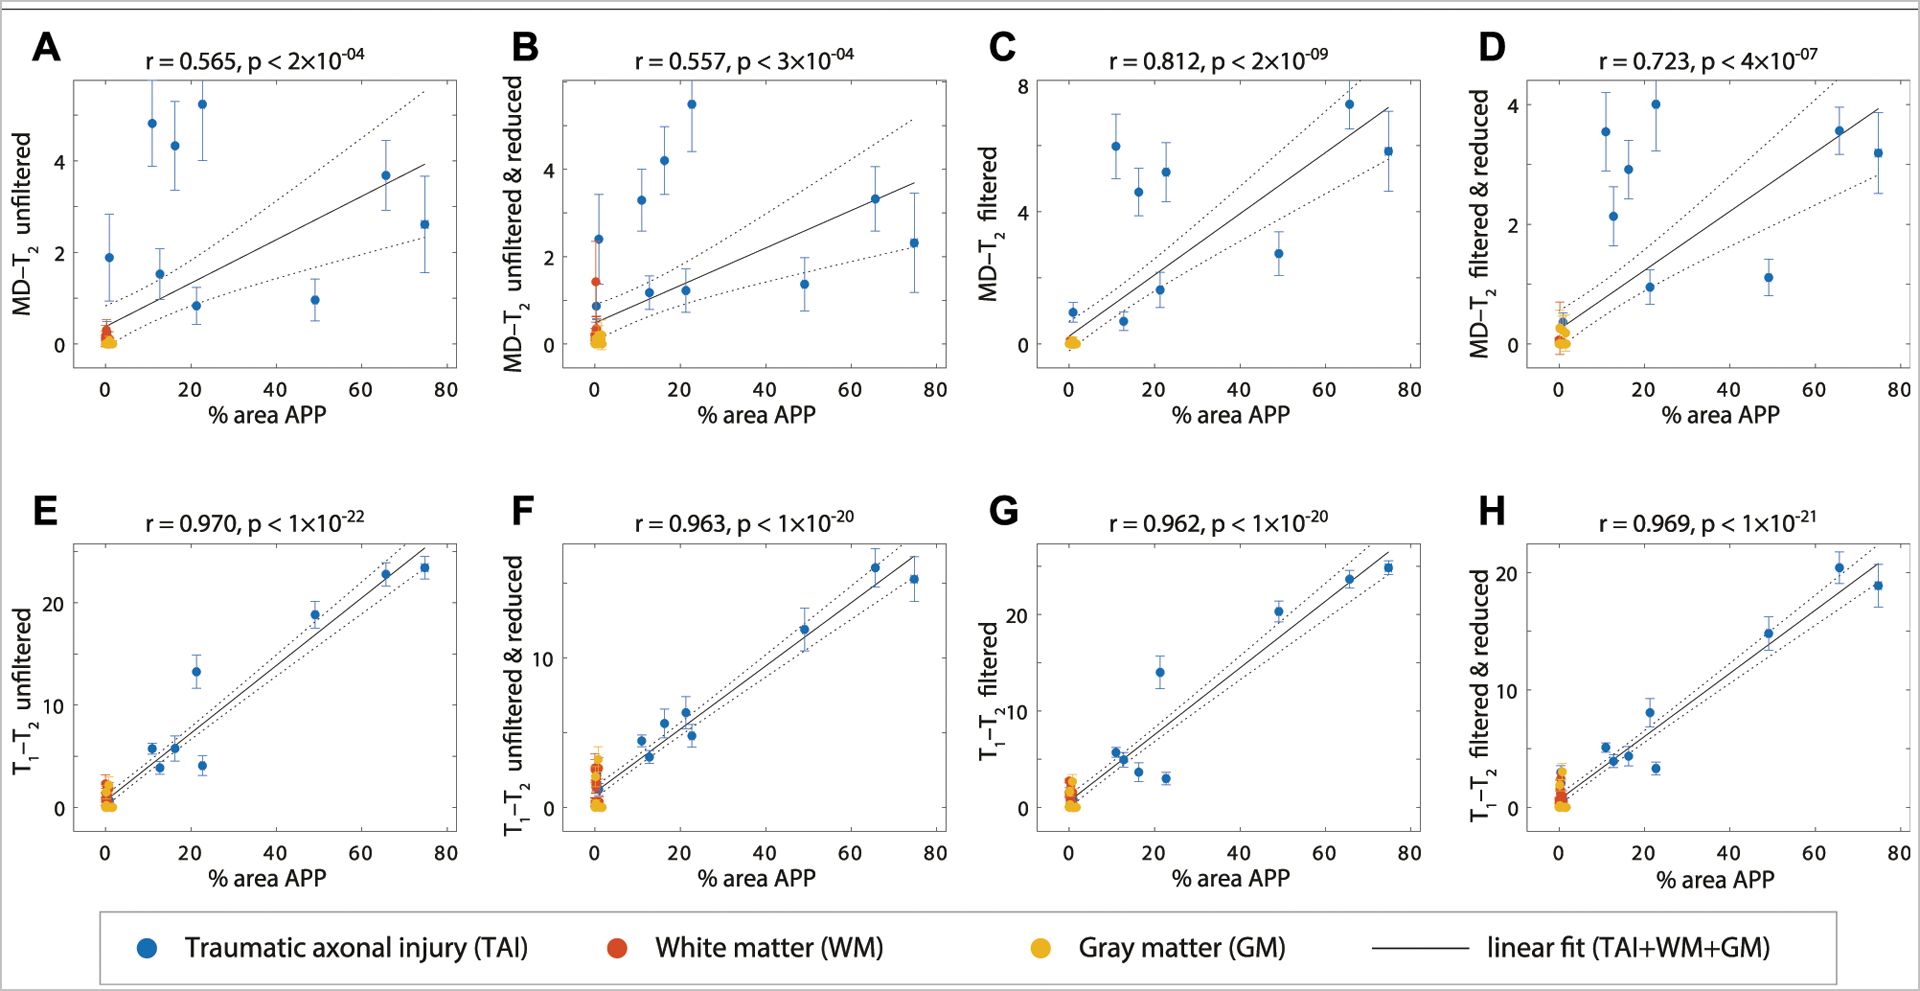
APP density (% area) from 36 tissue regions (APP-positive regions from each TBI case, WM and GM regions), and its correlation with injury biomarker parameter under different experimental conditions. Individual data points represent the mean ROI value from each post-mortem tissue sample. Scatterplots of the mean (with 95% confidence interval error bars) % area APP and (A) MD-T2 unfiltered (B) MD-T2 unfiltered and reduced (C) MD-T2 filtered (D) MD-T2 filtered and reduced (E) T1-T2 unfiltered (F) T1-T2 unfiltered and reduced (G) T1-T2 filtered, and (H) T1-T2 filtered and reduced, show positive and significant correlation with APP density.