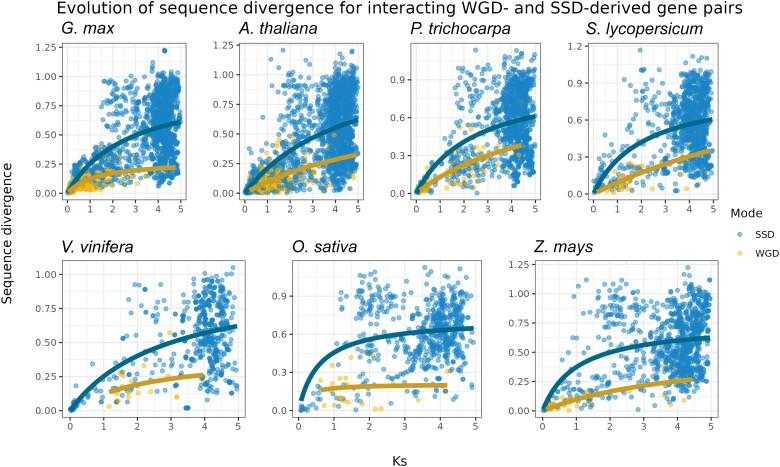
Fig. 2.
Evolution of sequence divergence for interacting WGD- and SSD-derived gene pairs. Rates of nonsynonymous substitutions per substitution site (Ka) were used to represent sequence divergence, and rates of synonymous substitutions per substitution site (Ks) were used as a proxy for time. As linear models cannot account for saturation at higher Ks values, a Michaelis–Menten curve was fitted in the scatter plot. The plot shows that WGD-derived gene pairs have lower sequence divergence over time as compared to SSD-derived pairs.

