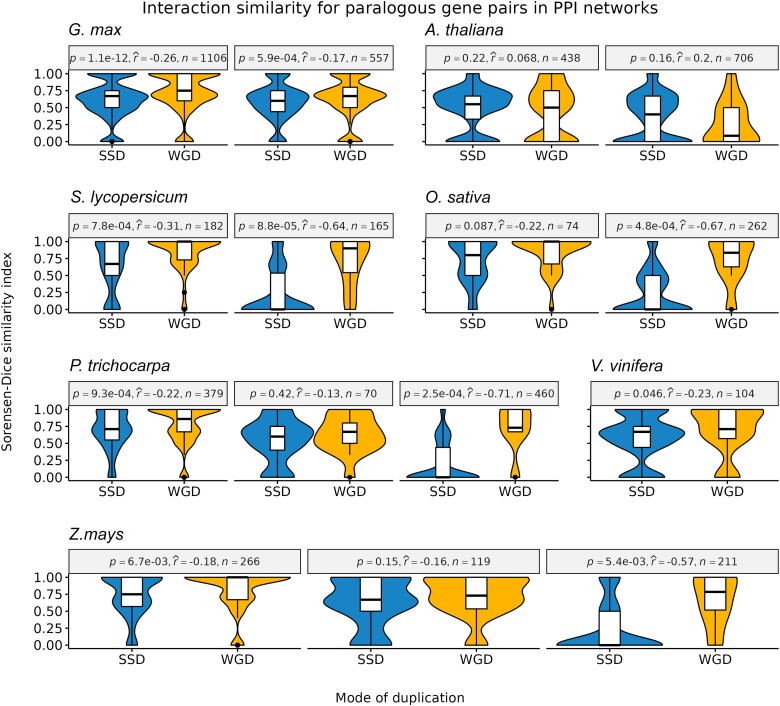
Fig. 3.
–Sorensen–Dice similarity indices were used to indicate interaction similarity. For each species, different panels indicate gene pairs from different age groups (defined based on Ks peaks, see Materials and Methods for details), with panels arranged from left to right in chronological order (from younger to older groups). Overall, WGD-derived gene pairs have a higher interaction similarity as compared to SSD-derived gene pairs, especially for older duplicates (Mann–Whitney U test; P < 0.05). Effect sizes were measured using point-biserial correlation coefficients.

