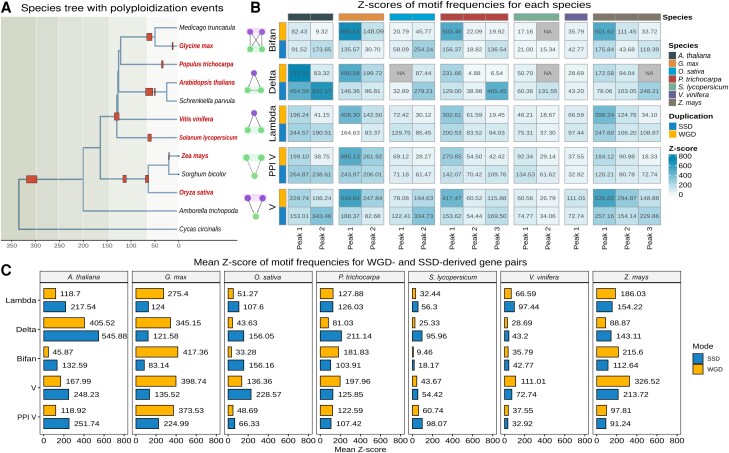
Fig. 4.
Z-scores of network motif frequencies in each species. (A) Species tree with polyploidization events indicated. Species included in this work are highlighted in bold red text. Red boxes represent polyploidization events. The timetree was obtained from the TimeTree database (Kumar et al. 2022). (B) Z-scores of motif frequencies by species and Ks peak-based age group. Z-scores <2 were considered not significant and set to NA. The plot shows that genes derived from recent WGD events are more frequently part of network motifs than genes from more ancient WGD events. (C) Mean Z-score of motif frequencies for WGD- and SSD-derived gene pairs. Recent polyploids have higher motif frequencies than ancient polyploids. WGD-derived genes have a greater contribution to motif formation in recent polyploids, whereas SSD-derived genes are more frequent in ancient polyploids.

