. 2023 Jun 9;14(26):7310–7326. doi: 10.1039/d3sc01890c

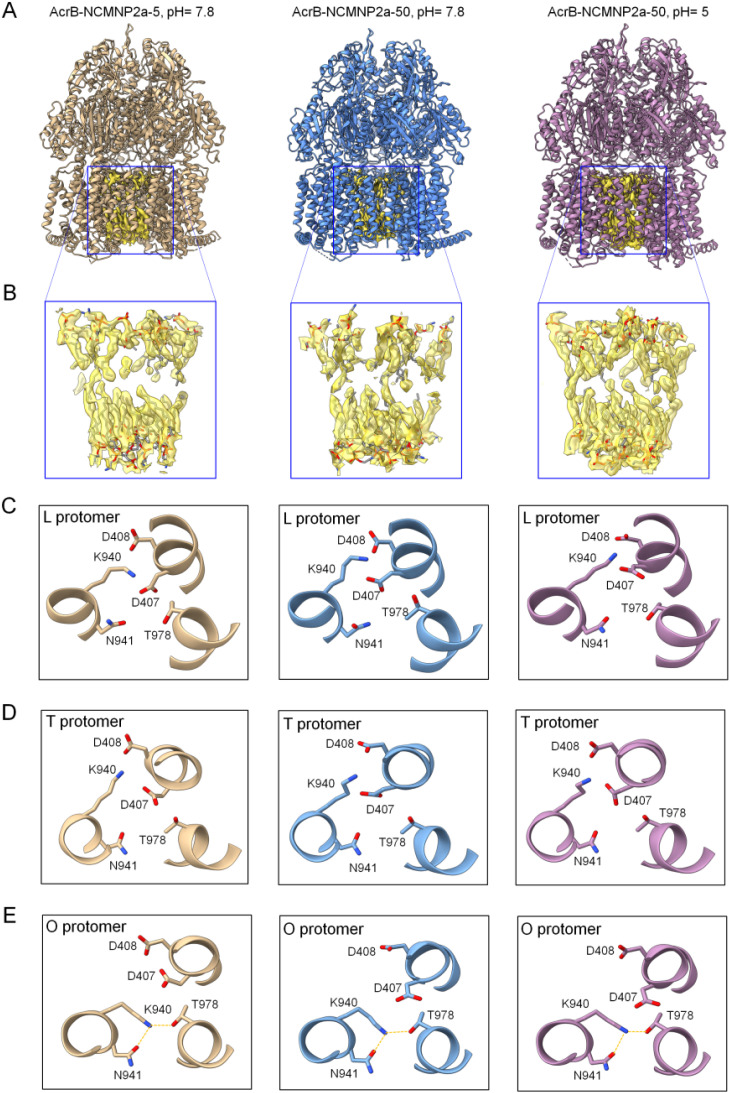
Fig. 3. Cryo-EM structures of AcrB–NCMN particles. (A) Ribbon diagrams of the entire AcrB complex warped by different polymers at various pH. These structures were obtained through manual fitting of the 6BAJ structure into the maps using Coot software. (B) Expanding views of blue box regions featuring the lipid bilayer located in the central cavity. The lipid bilayer was confidentially assigned with good quality of the EM map. (C) Configuration of protomer L of AcrB in different NCMN polymers. Left panel: NCMNP2a-5, pH = 7.8, middle panel: NCMNP2a-50, pH = 7.8 and right panel: NCMNP2a-50, pH = 5. (D) Configuration of protomer T of AcrB in different NCMN polymers. Left panel: NCMNP2a-5, pH = 7.8, middle panel: NCMNP2a-50, pH = 7.8 and right panel: NCMNP2a-50, pH = 5. (E) Configuration of protomer O of AcrB in different NCMN polymers with dotted lines (yellow) depicting the possible hydrogen bonds between residues. Left panel: NCMNP2a-5, pH = 7.8, middle panel: NCMNP2a-50, pH = 7.8 and right panel: NCMNP2a-50, pH = 5.

Fig. 3