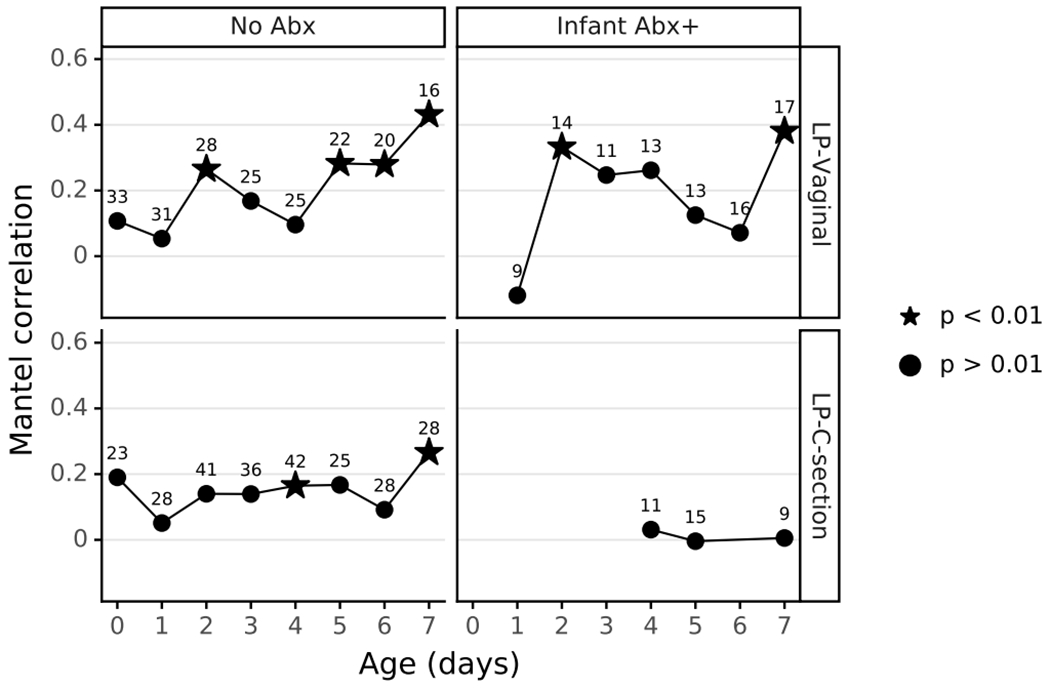
Extended Data Figure 10. Mantel correlation between metabolome and 16S profile over time.

Stool, oral, and skin samples with matched 16S and metabolomics data were divided by delivery mode, and antibiotic exposure, then Mantel tests were run for each day to measure the relation between the two data types over time. Significant Mantel correlations are depicted as stars. Sample size for each comparison shows as the number above each point.
