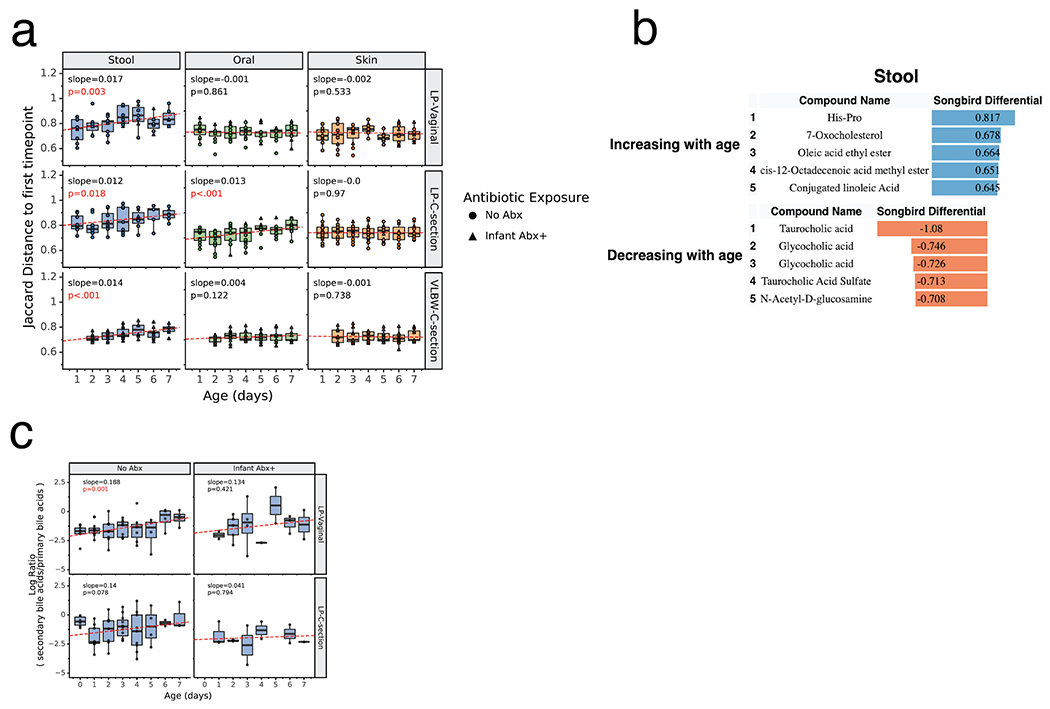
Figure 5. Metabolomics profiles change over the first week after birth.

a) Within-infant metabolome distance to first sample over time. For each infant, the Jaccard distance to the first sample (day 0 for LP infants, day 1 for VLBW infants) is plotted over time for each body site. Boxplots show median and interquartile range with whiskers extending to the furthest value within 1.5 times the edge of the interquartile range. Red lines show the fitted linear mixed effect model with individual as a random effect and age as a fixed effect. P-value and slope of the age variable shown. Stool samples for all cohorts (LP-Vaginal, LP-C-section, VLBW C-section) and oral samples for LP-C-section infants have a significant increasing slope, corresponding to increased distance from the first time point over the first week after birth. All data points are shown with shape indicating infant antibiotic exposure. b) Top 5 identified metabolites positively and negatively associated with age based on Songbird model including LP infants. Songbird model fit Q2=0.017. c) Log ratios of secondary bile acids over primary bile acids, identified using GNPS annotations to structural family matches. Linear mixed effects models were run in the same way as panel a. Refer to Extended Data Table 3 for sample sizes in each comparison.
