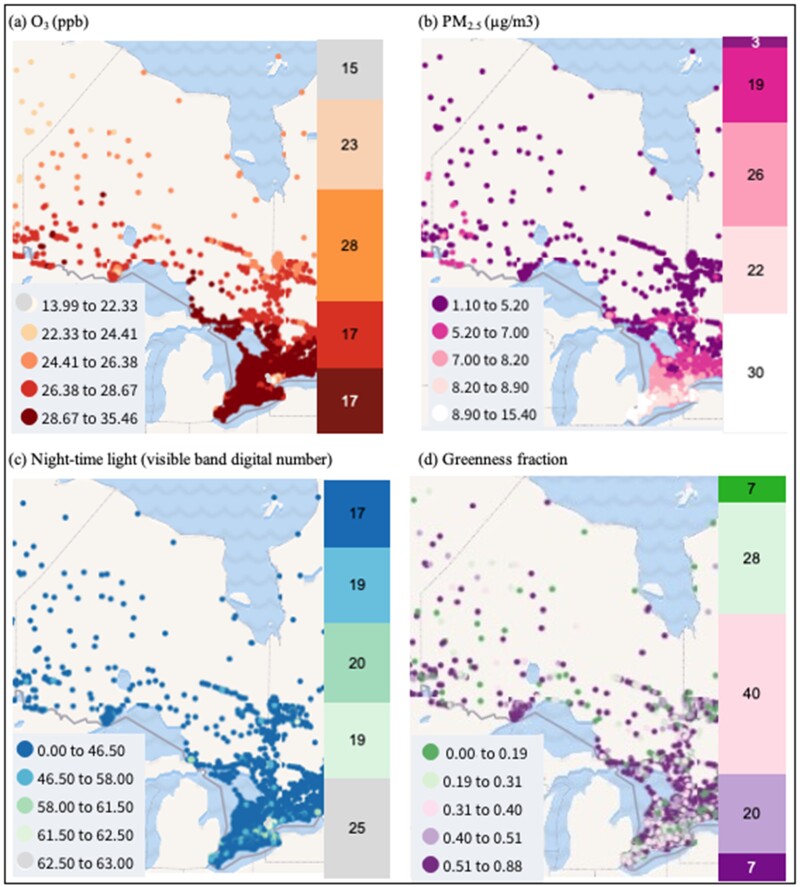
Figure 2.
Distribution of the measures of O3, PM2.5, night-time light and greenness. From (a) to (d) are ozone (O3), fine particulate matter (PM2.5), night-time light and greenness, respectively. The left panel for each subfigure is the annual average concentrations for all of Canada (source: canuedata.ca/map.php), in which the filled circles in different colours are quintiles of the distribution. The right panel for each subfigure is the frequency distribution (%) in the Ontario Health Study (OHS)

