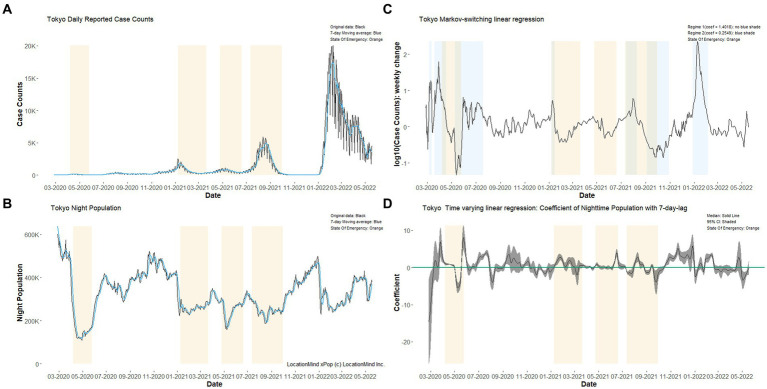
Figure 1.
Time series plots showing the daily reported case counts of COVID-19 and daily downtown population from 10:00 PM to 11:59 PM in Tokyo, 2020–22. Tokyo’s (A) daily reported COVID-19 case counts and (B) Night-time population in designated areas from 10:00 PM to 11:59 PM are shown in the left column (light blue lines show 7-day moving averages). The results of Markov switching linear regressions assuming two hidden states (C) and time-varying linear regression (D) are shown in the right column. In all figures, light orange shading corresponds to four publicly declared “State of Emergency” periods. For technical details of (C,D), see Supplementary material. The same figures for Aichi and Osaka are shown in the Supplementary material.

