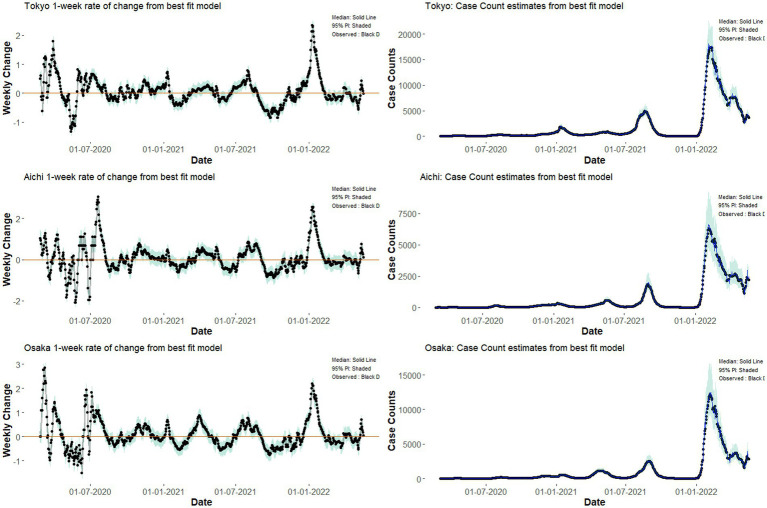
Figure 3.
Model estimates of weekly case counts (left column) and case counts (right column) by the fixed effect regression models for Tokyo, Aichi, and Osaka. Dots represent observed case count by Ministry of Health, Labor, and Welfare, while lines represent the expected value from our fixed-effect regression model. Shaded areas represent the region of 95% prediction intervals computed from the posterior distribution.

