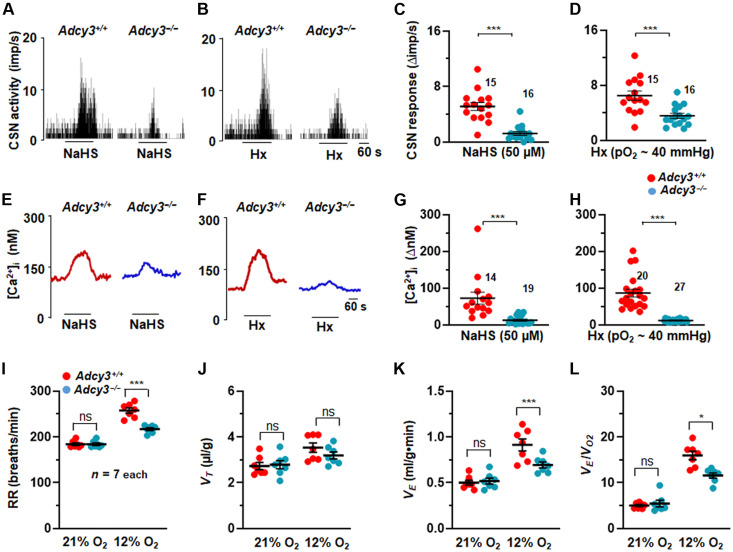
Fig. 8. CSN and glomus cell responses to NaHS and hypoxia are impaired in Adcy3 mutants.
(A and B) Examples of CSN responses to NaHS [50 μM in (A)] or hypoxia (Hx; PO2 ~ 40 mmHg) (B) from WT and Adcys3 −/− mice. Black bars represent duration of NaHS and Hx application. Means ± SEM along with individual data (stimulus-baseline activity) are presented for NaHS in (C) and for hypoxia in (D). (E to H) [Ca2+]i responses to NaHS and Hx in glomus cells. (E and F) Examples of [Ca2+]i responses to NaHS (50 μM) (E) and Hx (F), and means ± SEM along with individual data (stimulus-baseline) for NaHS in (G) and hypoxia (H). Numbers indicate the number of cells. (I to L) Average and individual data of respiratory rate (RR) (breaths/min) (I), tidal volume (VT, μl/g) (J), minute ventilation (VE, ml/g.min) (K), and ratio of minute ventilation/O2 consumption (VE/VO2) (L). *P < 0.05 and ***P < 0.001; ns, P > 0.05; two-way ANOVA with repeated measures followed by Holm-Sidak test.

