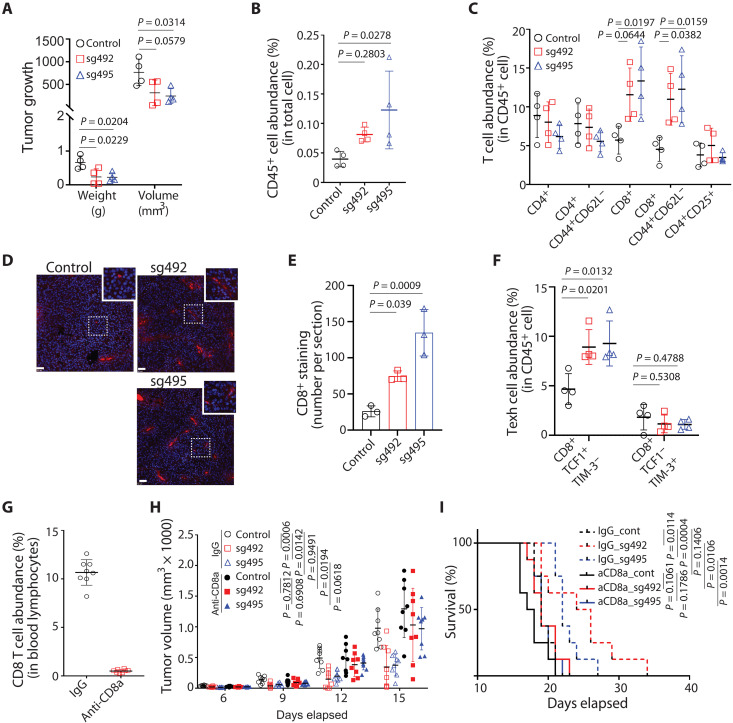
Fig. 3. NR2F6 limits murine melanoma growth by controlling CD8 T cell infiltration.
(A) Control and NR2F6 KO B16F10 cells were engrafted into C57BL/6 mice. Tumors were collected 12 days later and assessed for weight and volume. n = 4 mice for each group. (B) CD45+ cell abundance (expressed as a percentage) in cells within the singlet gate, as assessed by FACS. n = 4 mice for each group. (C) Abundance of T cell subtypes within all CD45+ cells, as assessed by fluorescence-activated cell sorter (FACS). n = 4 mice for each group. (D and E) Control and NR2F6 KO (sg492 and sg495) B16F10 tumor sections were prepared from tumors collected on day 18 after inoculation and stained with anti-mouse CD8 antibody. The number of CD8+ staining was visualized via microscope (×20) and counted in four random regions of each section. n = 3 mice for each group. Scale bar, 50μm. (F) Control and NR2F6 KO B16F10 tumors were prepared as in (A). FACS assessed the abundance of Texh subsets. n = 4 mice for each group. (G to I) Mouse groups were injected with control IgG or anti-CD8A antibodies to deplete CD8+ T cells. Eight days later, CD8+ T cell abundance was assessed in blood samples (G). Tumor growth (H) and overall animal survival (I) were monitored at indicated time points. n = 8 mice for each group. Data are presented as means ± SD. Statistical significance was assessed by one-way ANOVA with Dunnett’s test (A, B, C, E, and F), Student’s t test (G), two-way ANOVA with Sidak’s test (H), or by long-rank test (I).

