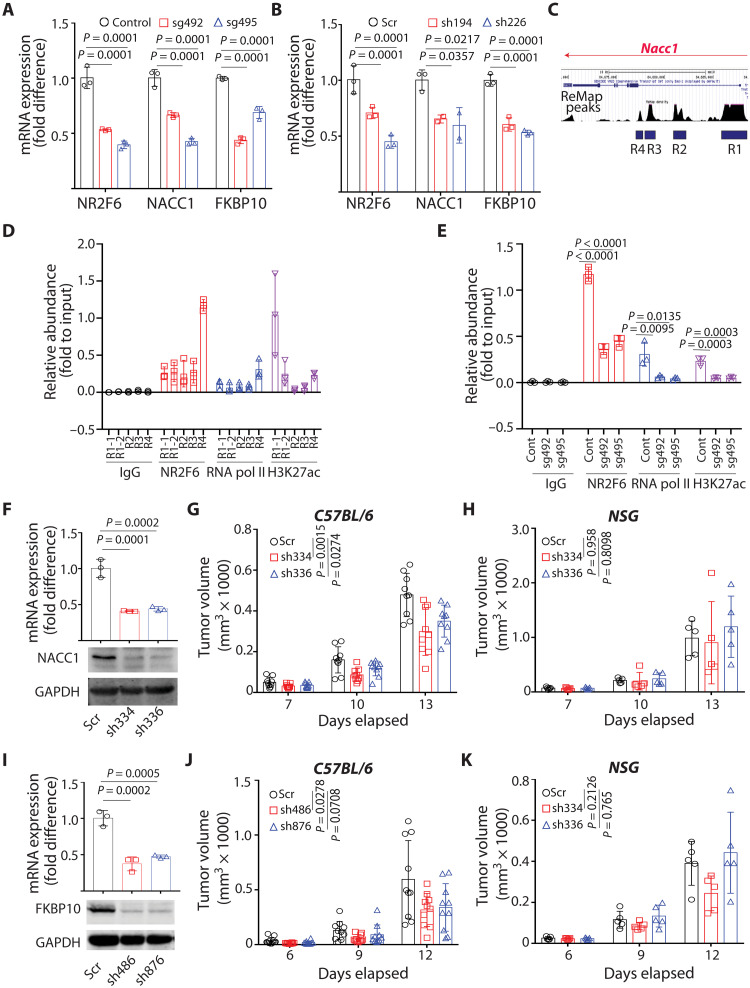
Fig. 5. Loss of NACC1 or FKBP10 attenuates tumor growth in mice with an intact immune system.
(A and B) Expression of indicated genes was assessed in NR2F6 KO (CRISPR-based) (A) or KD (shRNA-based) (B) B16F10 cells by qPCR. n = 3 for each group. (C) ReMap peaks predicted transcriptional regulatory regions of Nacc1. R1 included promoter and a part of intron1, and the other candidates (R2, R3, and R4) were predicted within intron1. (D) Abundance of NR2F6, RNA polymerase II, and H3K27 acetylation on each candidate region was assessed by ChIP-qPCR using corresponding antibodies and primers. Relative abundance to input (5% of pre-pulldown material) was calculated. n = 3 for each group. (E) Abundance of NR2F6, RNA polymerase II, and H3K27 acetylation on R4 was assessed in control and NR2F6 KO B16F10 cells. n = 3 for each group. (F) B16F10 cells were transduced with control scrambled (Scr) shRNA or two shRNAs (sh334 and sh336) targeting NACC1. mRNA and protein expression was assessed by qPCR and immunoblotting, respectively. n = 3 for each group. (G and H) Cells were then used to inoculate C57BL/6 (G) or NSG (H) mice. Tumor volumes were monitored at indicated time points. n = 9 mice (G) and n = 5 mice (H) for each group. (I to K) As in (F) and (H), B16F10 cells were transduced with control scrambled shRNA or two (sh486 and sh876) shRNAs targeting FKBP10. FKBP10 expression was assessed (I). n = 3 for each group. The growth of tumors emerging from transduced cells was monitored in C57BL/6 (J) or NSG (K) mice. n = 10 mice (J) and n = 5 mice (K) for each group. Data are presented as means ± SD. Statistical significance was assessed by one-way ANOVA with Dunnett’s test (A, B, E, F, and I) or two-way ANOVA with Dunnett’s test (G, H, J, and K).

