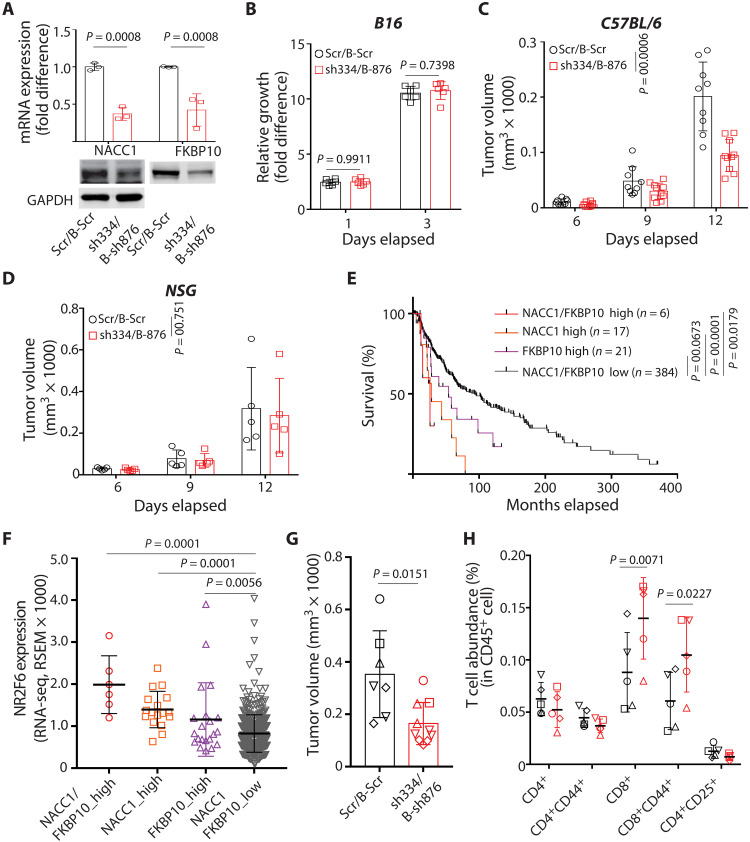
Fig. 6. Loss of NACC1 and FKBP10 phenocopies NR2F6 loss.
(A) B16F10 cells were transduced with scrambled shRNAs [Scr (puromycin resistant) and B-Scr (blasticidin resistant)] and one of two shRNAs (sh334 for NACC1 KD and B-sh876 for FKBP10 KD). mRNA and protein expression was assessed by qPCR and immunoblotting, respectively. n = 3 for each group. (B) Growth of transduced cells in vitro, as assessed by CellTiter-Glo. n = 6 for each group. (C and D) Transduced cells were used to inoculate C57BL/6 (C) or NSG (D) mice. Tumor growth was monitored at indicated time points. n = 9 and 10 mice for Scr/B-Scr and sh334/B-876 group, respectively. (E) Overall survival was assessed in patients with melanoma (SKCM in TCGA, n = 428) whose specimens showed both high NACC1 and high FKBP10 expression, high expression of just one, or low expression of both. (F) NR2F6 expression was assessed in groups of specimens in (E). (G and H) Scrambled (Scr/B-Scr) and NACC1/FKBP10 KD (sh334/B-sh876) B16F10 cells were engrafted into C57BL/6 mice. Tumors were collected 12 days later, and their volume was assessed (G). Different shapes of data points indicate the pooled cells for FACS analysis. n = 7 and 10 mice for Scr/B-Scr and sh334/B-876 group, respectively. (H) Shown is the abundance of T cell subtypes within all CD45+ cells based on FACS. n = 5 pooled samples for each group. Data are presented as means ± SD. Statistical significance was assessed by Student’s t test (G) with Holm-Sidak’s test (A and H), one-way ANOVA with Dunnett’s test (F), two-way ANOVA with Sidak’s test (B to D), or log-rank test (E).

