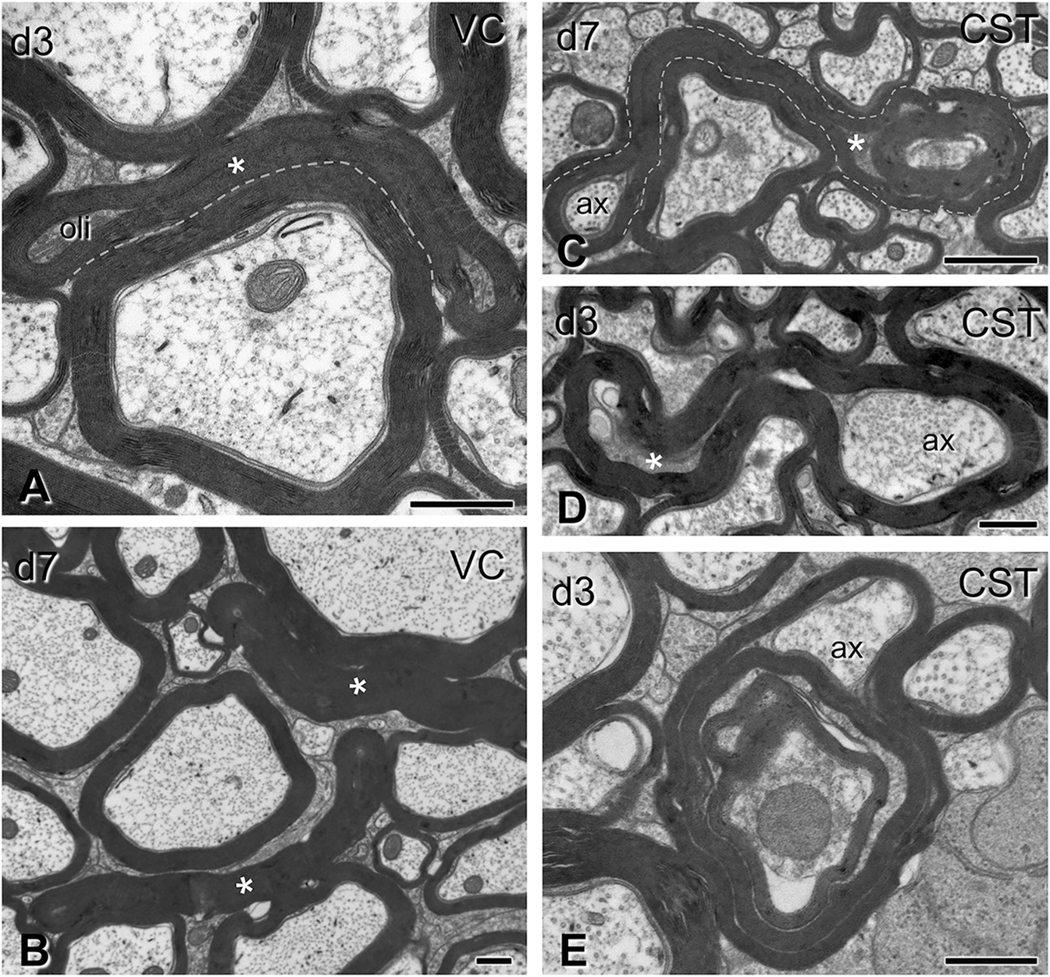
Fig. 5.
Gross myelin pathology in the form of collapsed myelin or excess myelin profiles. Electron micrographs are from sections through the ventral column in panels (A-B) and the corticospinal tract in panels (C-E), (C6–7 level). (A-B) Collapsed myelin profiles, i.e., myelin sheaths closely apposed to each other with little or no tissue between them, are seen at 3 days (A) and, more commonly, at 7 days (B) post-injury (asterisks). Oli, oligodendrocyte. (C-E) Excess myelin profiles appear as morphologically complex tube-like structures with morphological similarities to collapsed myelin objects. These profiles loop around normal-looking or abnormal axons or oligodendrocyte cytoplasm. Note the ensheathing of normal axonal material (ax) in (C), but also surrounding of tissue with electron density typical of oligodendrocytes (C–D, asterisks). These various tissues may be contained in the same enclosure (C,D). Excess myelin often wraps itself in concentric loops containing normal and abnormal tissue elements in the form of tomacula (E). CST, corticospinal tract; VC, ventral column. Scale bars: A, B, D, E, 500 nm; C, 800 nm.

