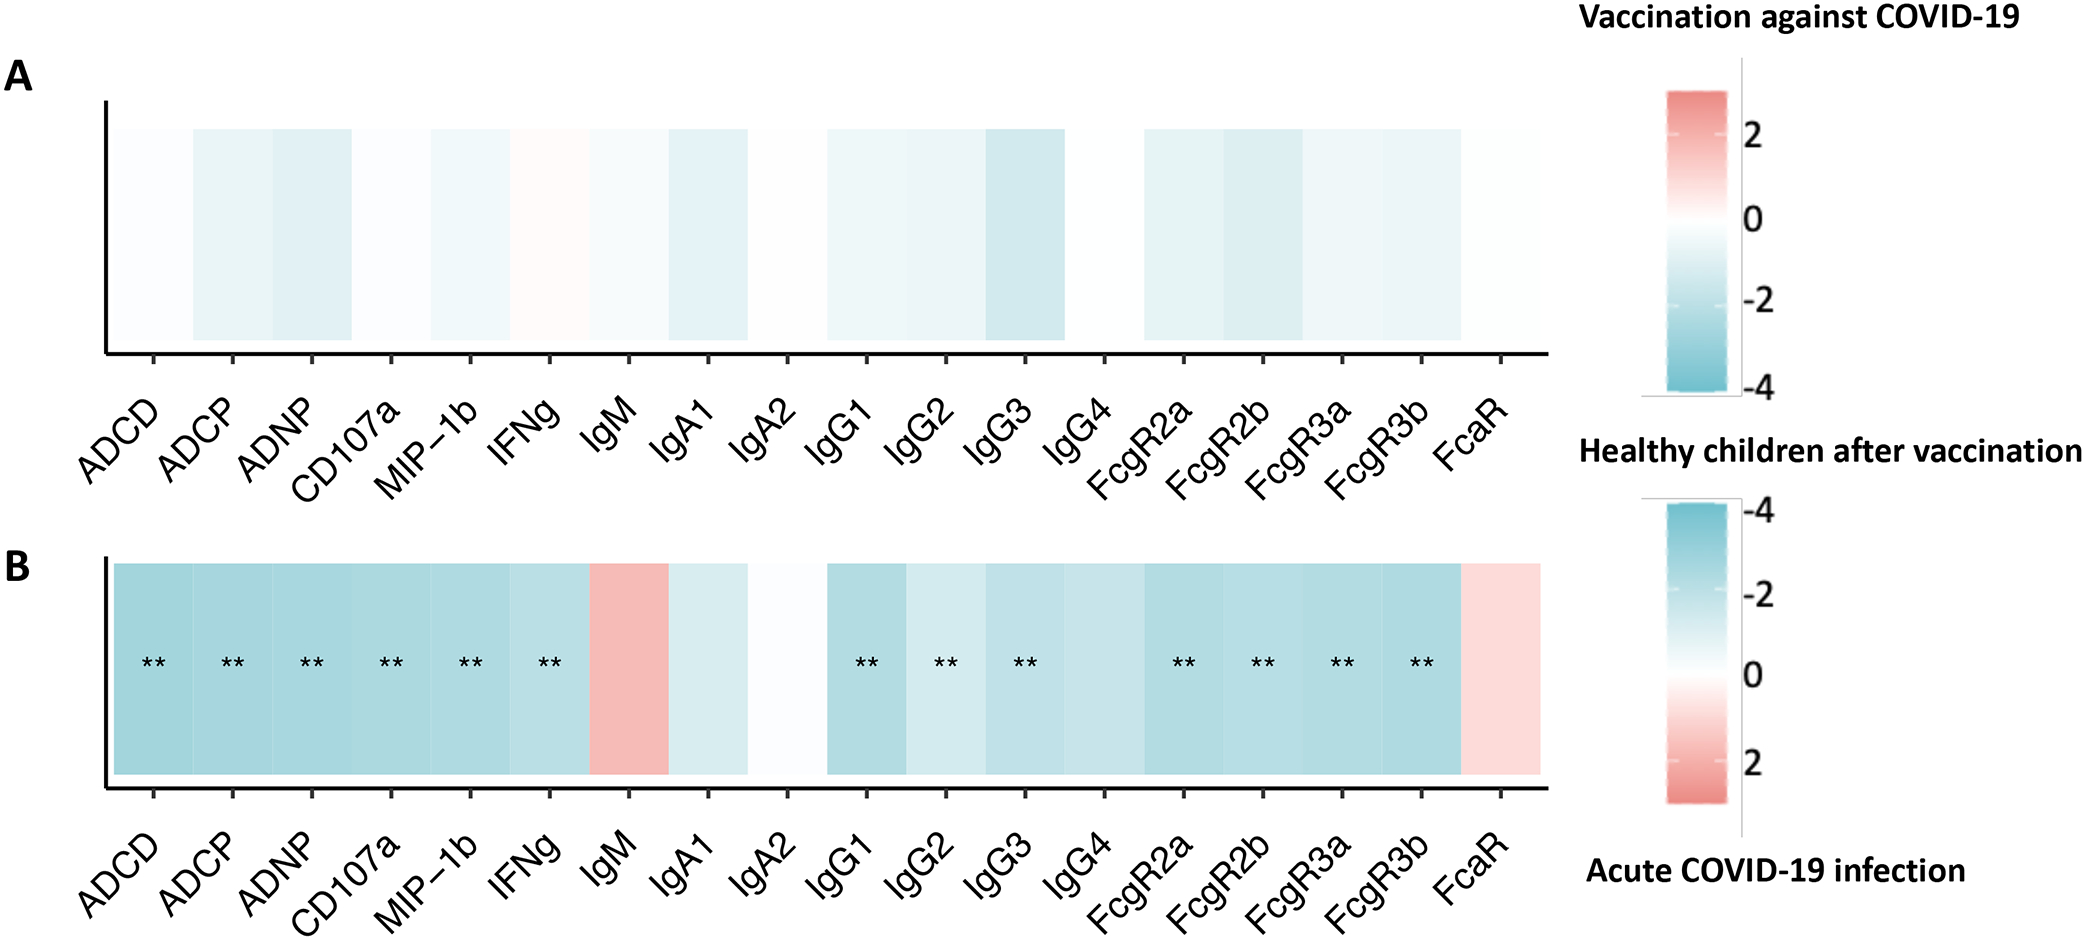
FIGURE 5.

Heatmaps showing WT-Spike-specific differences between the (A) active chemotherapy group with SARS-CoV-2 infection and the healthy vaccinated group and (B) active chemotherapy group after COVID-19 vaccination and healthy vaccinated group. The color of the tiles shows the group in which antibody response was higher: red for active chemotherapy group with SARS-CoV-2 infection and active chemotherapy group after vaccination, blue for healthy vaccinated group. Statistical significance was calculated with a Wilcoxon-signed rank test, followed by Benjamini-Hochberg correction for multiple testing. **p < 0.01.
