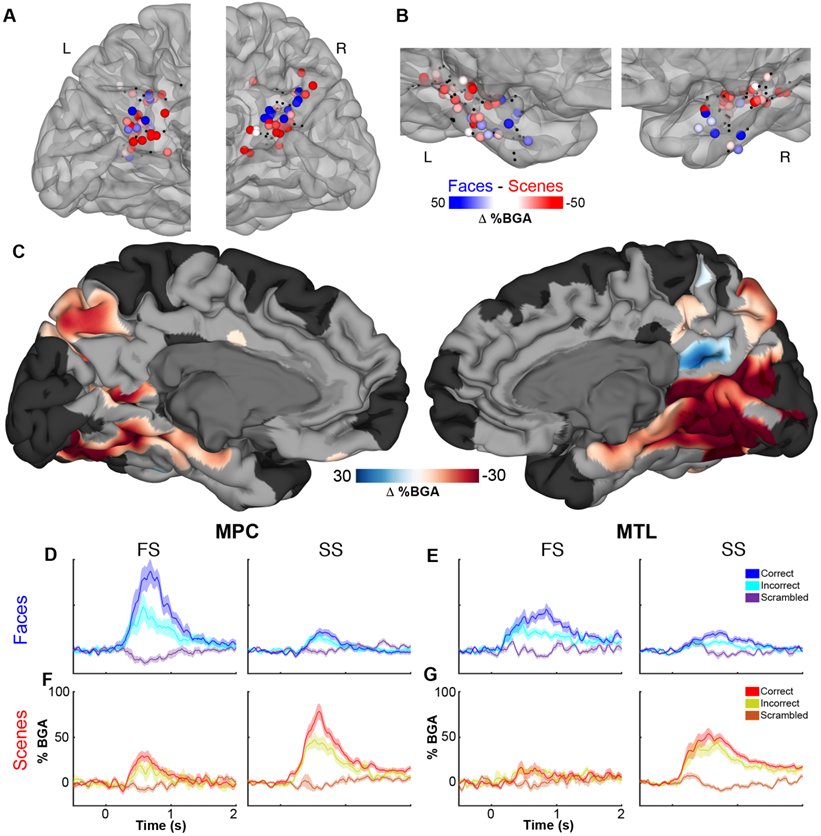
Figure 3. Category selectivity in MPC and MTL – population analysis.

Selectivity of responses in (A) MPC and (B) MTL for faces (blue) and scenes (red) in the time window of 500-1000 ms after stimulus onset (See also Figures S1 - S3). Non-selective electrodes (q>0.05) are black. (C) A population-level, surface-based MEMA contrasting (faces vs. scrambled faces) – (scenes vs. scrambled scenes) revealing regions of significant stimulus selectivity (p<0.01 corrected) in the ventral visual stream (See also Figure S4) and medial parietal cortex (See also Videos S1 - S3). Regions in black did not have consistent coverage for reliable MEMA results. Between-patient averaged BGA (mean ± SEM) in MPC (D,F) and MTL (E,G) at face selective (FS) or scene selective (SS) electrodes. Face (D,E) and scene (F,G) identification sensitivity in FS electrodes and SS electrodes.
