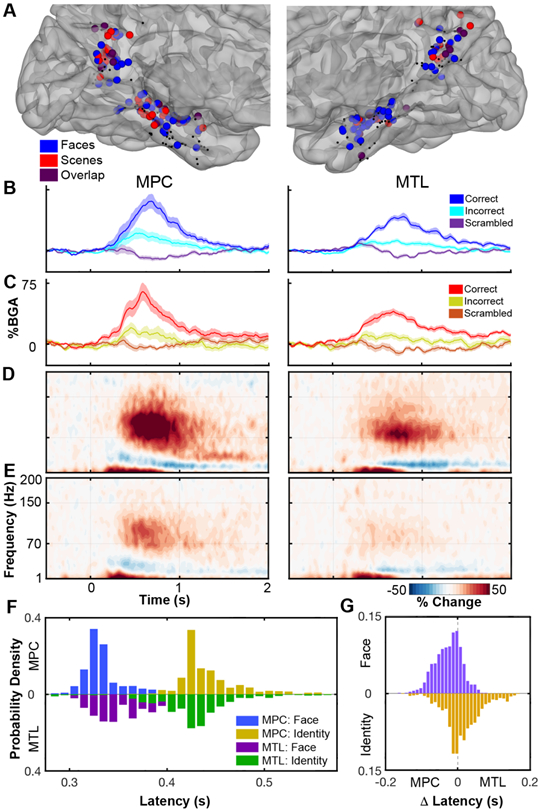
Figure 5. Identity sensitivity in MPC and MTL.

(A) Co-localization of identity selective electrodes (q<0.05) for face (blue) and scene (red) stimuli, and their overlap (purple), in MPC and MTL. Non-selective electrodes are black. Averaged BGA time courses (mean ± SEM) for face (B) and scene (C) identity sites. Grouped spectrograms showing broadband changes in face identity electrodes for correctly (D) and incorrectly (E) identified faces. (F) Bootstrap distribution determining the initial latency when it is possible to distinguish a face from a scrambled face or a known face from an unfamiliar one based on the BGA in both MPC and MTL. (G) Distribution of paired latency difference between regions.
