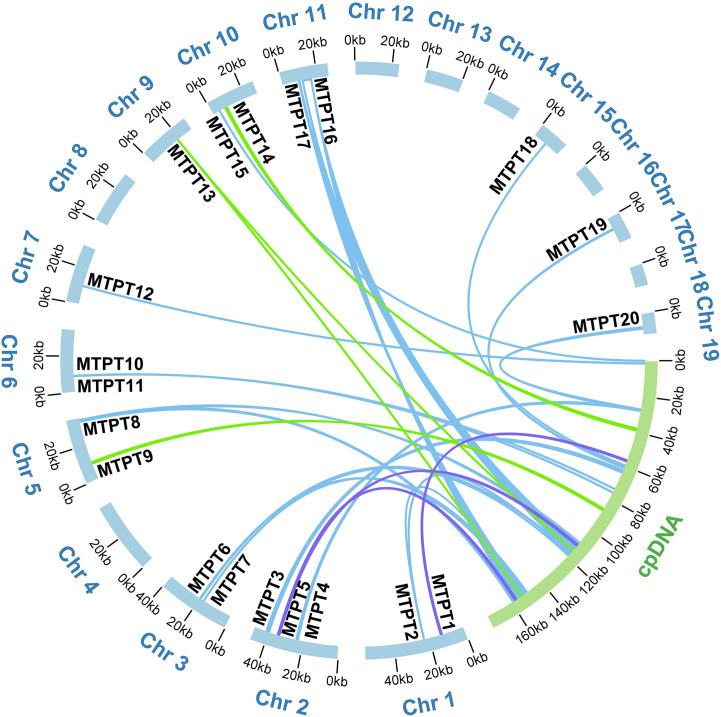
Figure 4.
Schematic representation of the distribution of MTPTs between the nineteen mitogenome chromosomes and the plastome of A. albus. The MTPTs on the chloroplast IR regions were counted only once. Different colors of ribbons represent different identities: purple: 70%-80%, green: 80%-90%, and blue: 90%-100%.

