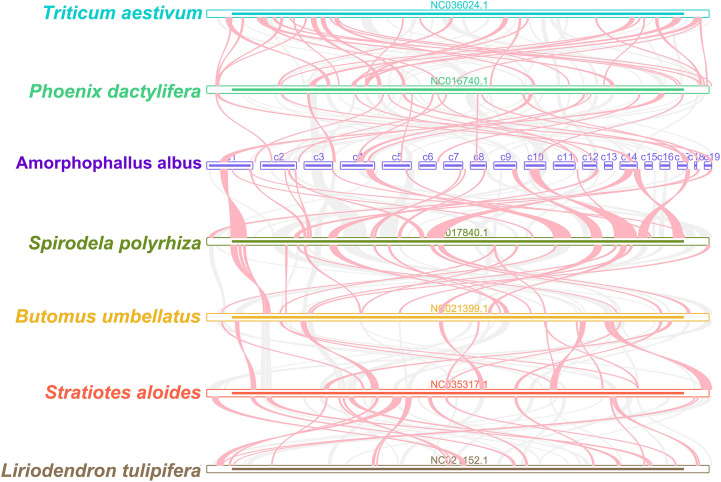
Figure 6.
Mitogenome synteny. Bars indicated the mitogenomes, and the ribbons showed the homologous sequences between the adjacent species. The gray ribbons indicate regions with homology and the red ribbons indicate where the inversion occurred. The homologous blocks less than 0.5 kb in length are not remained, and regions that fail to have a homologous block indicate that they are unique to the species.

