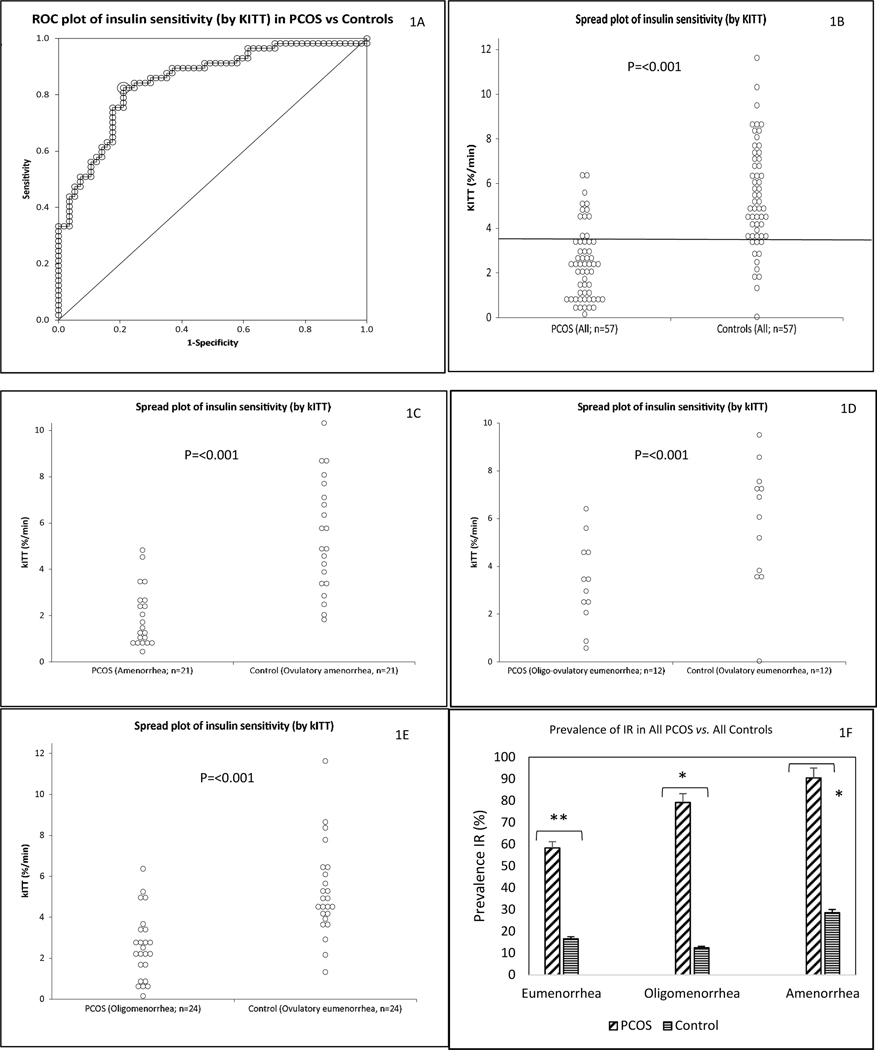
Fig. 1. Differences in measures of in vivo whole-body IR between PCOS and controls.
Subjects in the all cohort (57 PCOS and 57 BMI-matched controls adjusted for age, BMI and race) are depicted. IR was estimated by kITT (%/min) after a short insulin tolerance test. ROC plot of kITT values in PCOS (-ve) and controls (+ve), with the optimal cut-off value for kITT of 3.57 (%/min) (horizontal line) providing 79.7% specificity and 81.5% sensitivity in discriminating between PCOS and control participants (Fig. 1A, Fig. 1B). A scatter plot of differences in mean kITT values between PCOS and control participants for all the cohort (57 PCOS and 57 BMI-matched controls adjusted for age, BMI and race) (Fig. 1B), and for all the cohort subdivided according to menstrual categories (Fig. 1C, 1D and 1E for oligo-ovulatory eumenorrheic, oligomenorrheic and amenorrheic PCOS groups vs. respective ovulatory eumenorrheic groups, respectively) are also depicted. The prevalence of IR between each menstrual subtype of PCOS vs. respective ovulatory eumenorrheic groups is also shown (Fig. 1F).
AUC is area-under-the-curve; kITT is the rate constant for glucose disappearance during short ITT, and ROC is receiver operating characteristics (Fig. 1A).
**P=0.049 and *P<0.001 (Fig. 1F).

