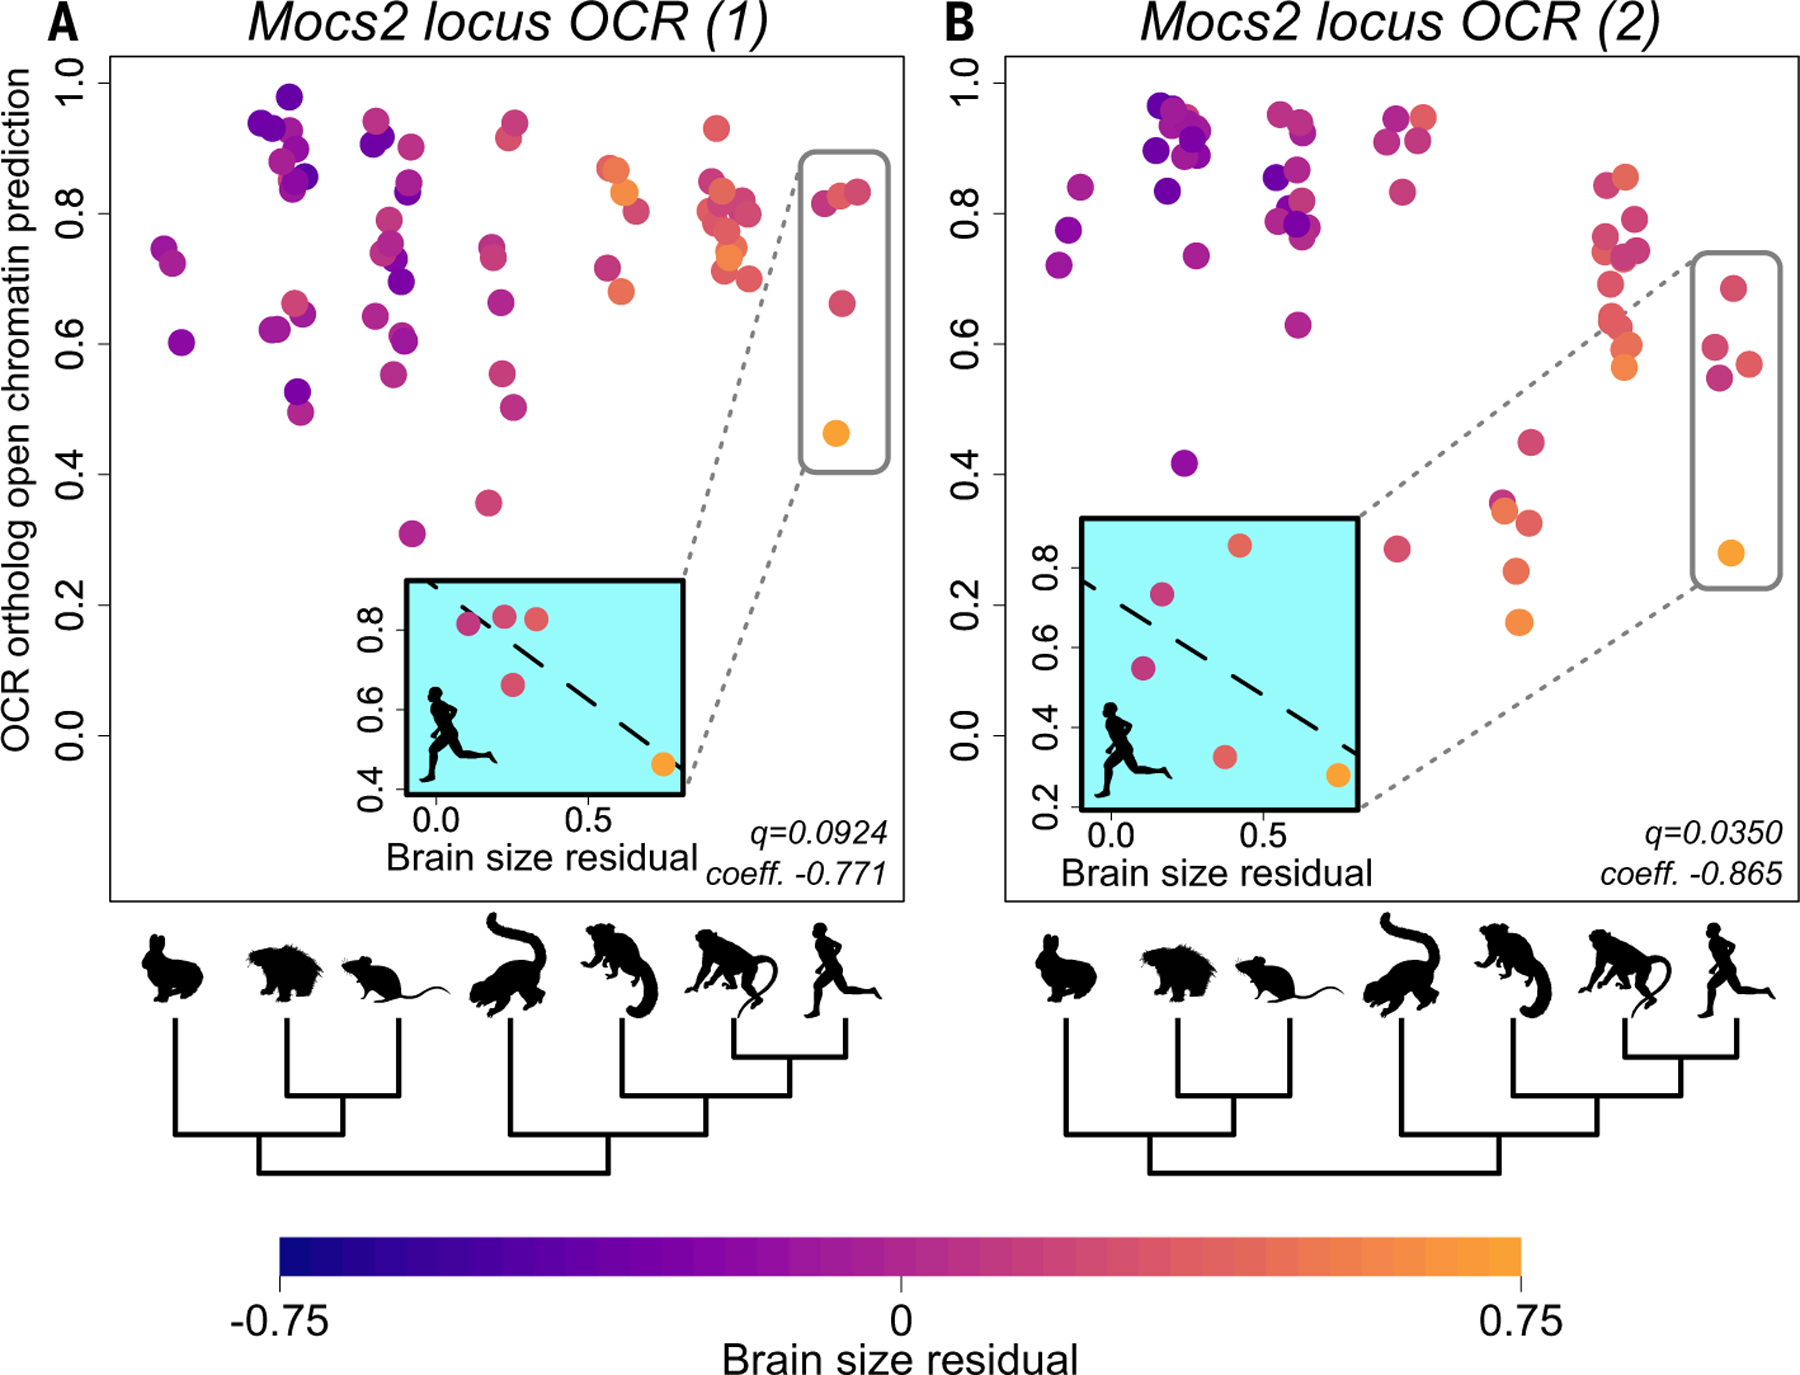
Fig. 5. Examples of associations between predicted PV+ interneuron OCR ortholog open chromatin and brain size residual.

(A and B) Each point represents an ortholog of the OCR in question in one species; species are grouped along the x axis by clade, as shown by the silhouettes and tree below (table S26). Points are colored by brain size residual following the scale at the bottom of the figure. The permulations-based Benjamini-Hochberg q-values the coefficient and the predicted open chromatin returned by phylolm are in the lower right of each panel. Negative association within Euarchontoglires between predicted PV+ interneuron open chromatin and brain size residual of two PV+ interneuron OCRs in the Mocs2 locus, chr13:114757413–114757913 (mm10) (A) and chr13:114793237–114793737 (mm10) (B), respectively. The hominoid clade is highlighted by a gray box in each panel, and scatterplots of predicted PV+ interneuron open chromatin versus brain size residual in Hominoidea are in the inset plots. Note that the lines in the inset plots are for illustration purposes only and are not based on the phylogenetic regression we used for TACIT; we ran the phylogenetic regression across all Euarchontoglires and not in specific clades.
