Figure 2.

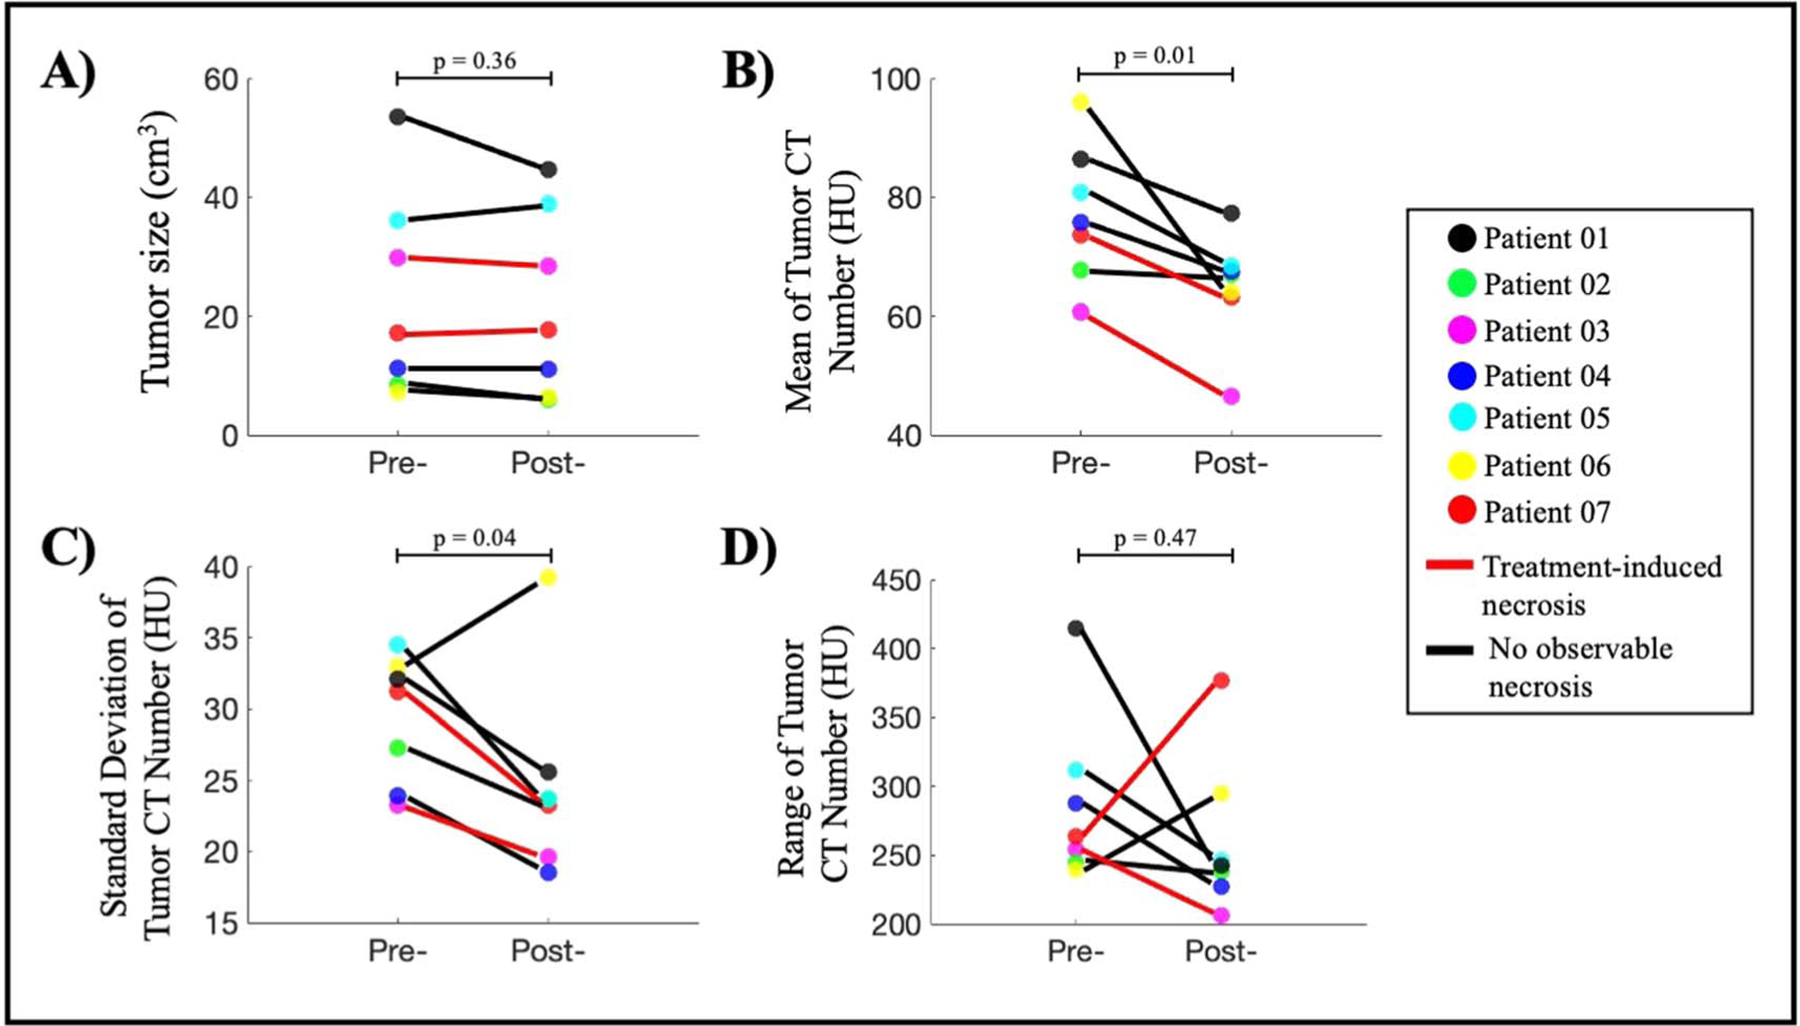
Overview of PDT-induced changes observed between pre- and post-treatment CT scans. (A) Tumor size measured from 3D segmentation of tumors shows no significant change (paired t-test, p-value = 0.36). (B) All patients show a reduction in mean tumor CT number, indicating the tumor density has decreased after PDT treatment (paired t-test, p-value = 0.01). (C) Six out of seven patients show a reduction in standard deviation of tumor CT number, suggesting that the intratumor variation has decreased after treatment (paired t-test, p-value = 0.04). (D) Range of CT number is decreased for five out of seven patients which indicates the reduction of intratumor variation after PD (paired t-test, p-value = 0.47).
