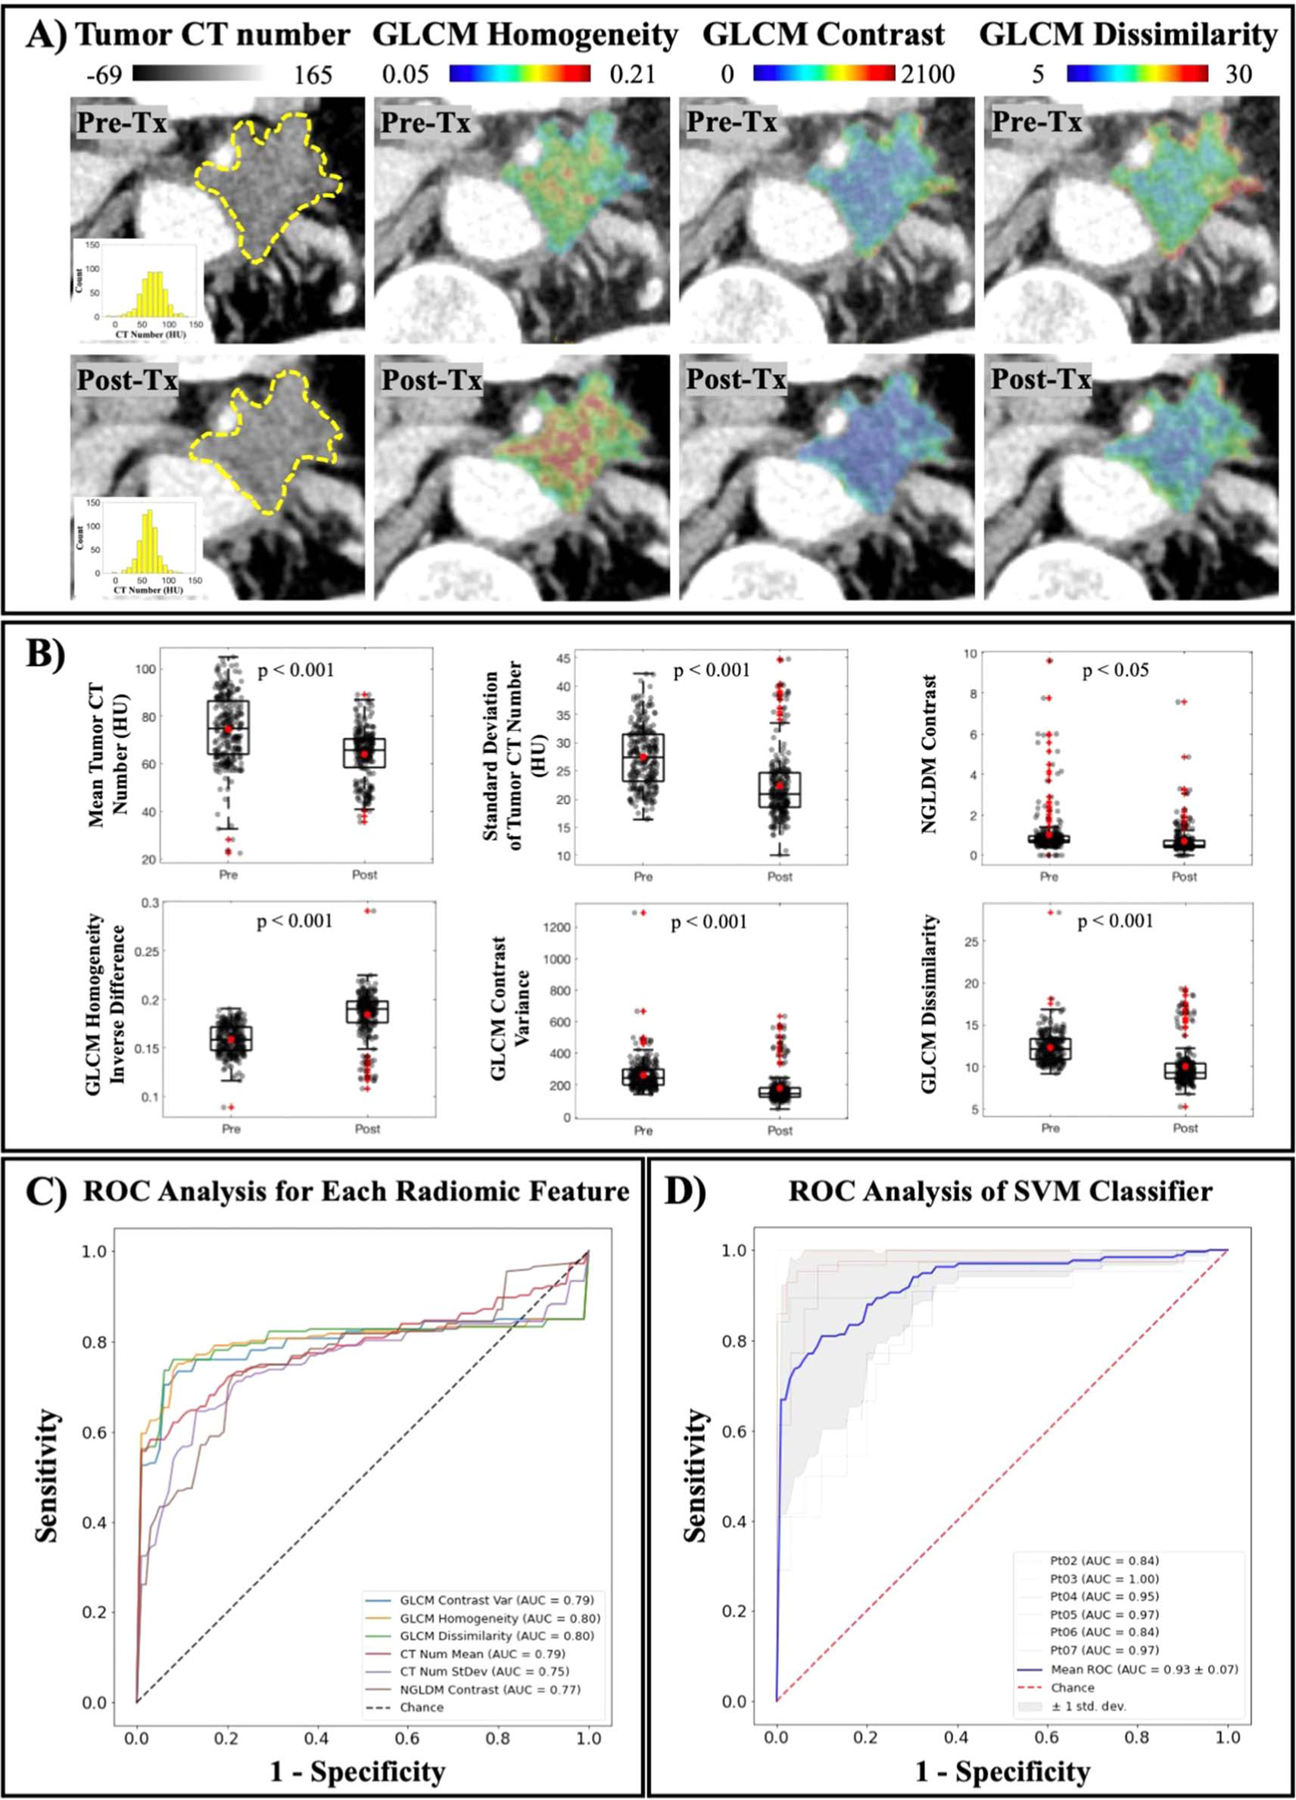
Figure 5.

PDP effects after light treatment are seen with texture analysis. (A) A visualization of intratumor changes due to light treatment quantified by GLCM texture analysis. Means of tumor CT number before and after treatment are 74 ± 23 HU and 67 ± 17 HU, respectively. Tumor homogeneity is increased, while levels of contrast and dissimilarity are decreased, indicating a more uniform tumor attenuation profile. (B) Texture features that showed a statistical significance between Pre-Tx and Post-Tx scans are reported (n = 235 tumor slices) (C) Mean ROC curve for each reported feature calculated for all patients except for Patient 01, showing AUC values in the range of 0.75–0.80. (D) Mean ROC curve of combined classifiers using SVM model in blue yielded a better performance than any single classifier (AUC value is 0.93 ± 0.07). Leave-one-patient-out cross validation ROC curves are showed for all patients except Patient 01, and the shaded area indicated the ± 1 standard deviation of this cross validation.
