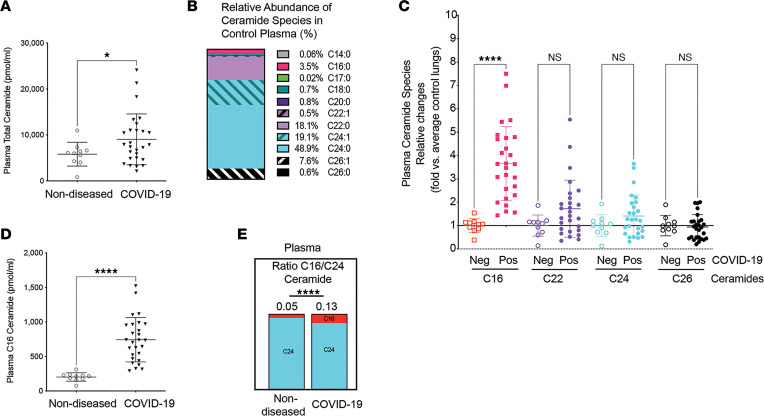
Figure 1. Ceramides in plasma of COVID-19 patients compared to nondiseased individuals.
(A) Total ceramide levels measured by tandem mass spectrometry. (B) Relative abundance (% of total) of ceramide species in plasma of nondiseased healthy individuals. (C) Relative abundance (fold change) in indicated ceramide species, with horizontal black line at 1 indicating no change compared to nondiseased controls. (D) Absolute circulating levels of C16:0-ceramide. (E) Ratio of C16/C24 ceramide species. Each data point represents data from a distinct individual. Mean ± SD. *P < 0.05; ****P < 0.001 by Shapiro-Wilk test (A and D; α = 0.05, data normally distributed), unpaired t test with Welch’s correction (A, D, and E), or 1-way ANOVA with Tukey’s multiple-comparison test (C).

