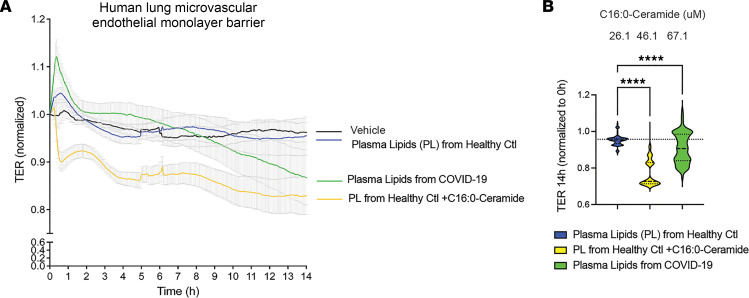
Figure 4. Effect of COVID-19 patient plasma lipids compared to control healthy plasma lipids on human lung microvascular barrier function.
(A) Transcellular electrical resistance (TER) normalized to the time of initial recording (± SEM), measured over time (hours) following addition of lipids extracted from plasma of healthy individuals (Ctl PL), plasma of COVID-19 patients (COVID PL), Ctl PL supplemented with C16:0-ceramide (20 μM), or vehicle. (B) Violin plots of TER measured at 14 hours. Median and quartiles are shown by horizontal solid and interrupted lines, respectively. Data non-normally distributed (Kolmogorov-Smirnov). Noted above the plots are C16:0-ceramide concentrations (mean) in the respective experimental conditions, measured by mass spectrometry. ****P < 0.001 by 1-way ANOVA with Kruskal-Wallis multiple-comparison test.

