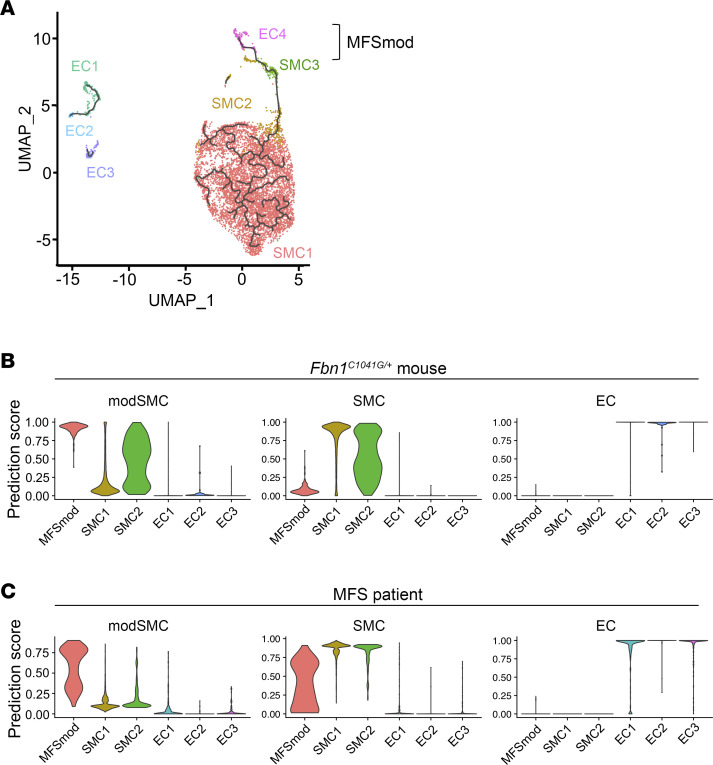
Figure 3. Transcriptomic similarities between modulated aortic cells in MFS mice and patient.
(A) Trajectory analysis of EC and SMC subpopulations in both WT and Fbn1mgR/mgR samples indicating dynamic modulation between SMC3 and EC4, thus clustered together as MFSmod cells. (B and C) Violin plots showing the degree of transcriptomic homology of EC and SMC subpopulations in the ascending aorta of Fbn1mgR/mgR mice vs. either (B) the Fbn1C1041G/+ aortic root/ascending aorta or (C) the aortic root of an MFS patient (9).

