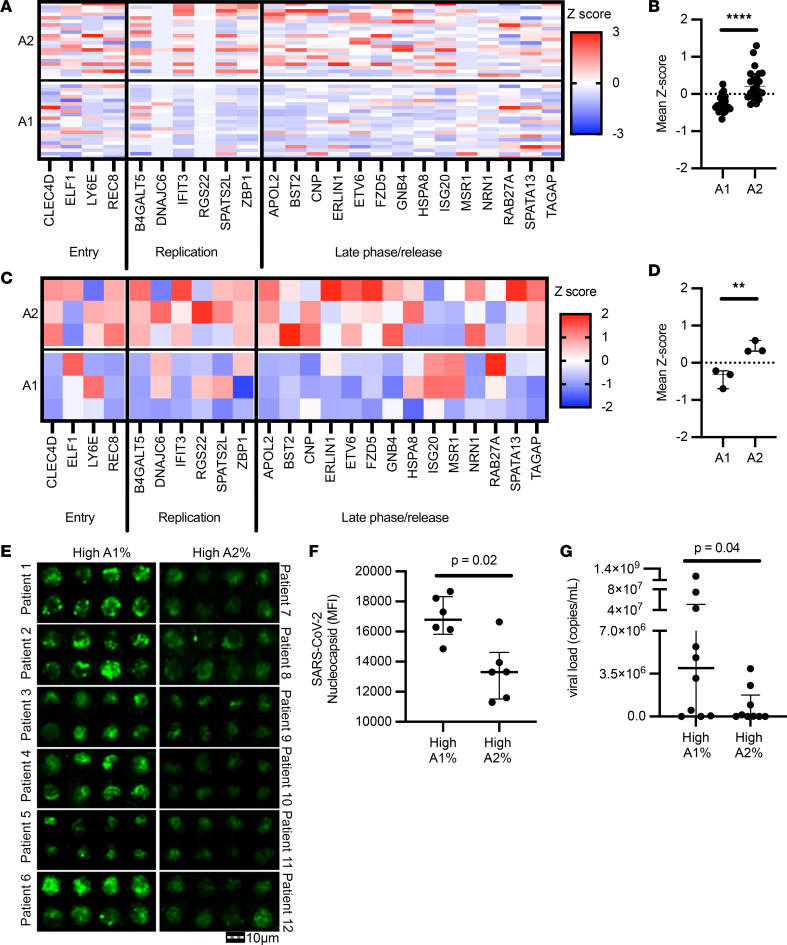
Figure 3. A2 neutrophils show differential anti–SARS-CoV-2 responses.
(A and B) Expression analysis of genes implicated in SARS-CoV-2 intracellular antiviral response, with mean z scores. Data were obtained from sc-RNA-seq and each column represents 1 patient (n = 21 per group). (C and D) A1 and A2 neutrophils generated using an in vitro transmigration model showed differential gene expression for SARS-CoV-2 intracellular antiviral response. (E) Airway neutrophils from a subset of patients with high A1 or high A2 frequencies (n = 6 per group) were stained for SARS-CoV-2 nucleocapsid (green) and acquired by image cytometry (see Supplemental Figure 3). Scale bar: 10 μm. (F) Patients with high A1 percentage showed increased presence of intracellular SARS-CoV-2 in airway neutrophils. (G) Patients with high A1 percentage showed increased presence of extracellular SARS-CoV-2 in the mBAL supernatant (n = 19 patients). Results are shown as median and interquartile range. Statistical analysis was performed using Wilcoxon’s rank-sum test for unpaired analysis. **P < 0.01, ****P < 0.0001.

