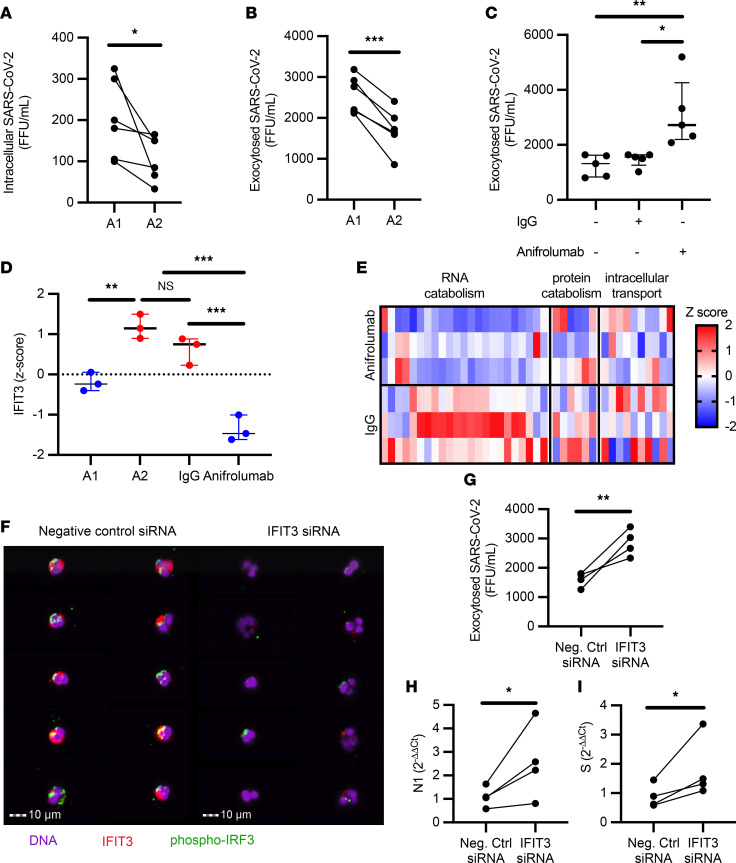
Figure 4. IFIT3 signaling modulates viral clearance in A2 neutrophils.
(A) A1 and A2 neutrophils incubated with SARS-CoV-2 (MOI = 1) (n = 6 neutrophil donors). (B) A1 and A2 neutrophils show differential exocytosis of infectious SARS-CoV-2 (n = 6 neutrophil donors). (C) Type I interferon blockade with anifrolumab increased exocytosis of infectious SARS-CoV-2 in A2 neutrophils (n = 5 neutrophil donors) compared with IgG control or media alone. (D) IFIT3 expression by RNA-seq. (E) Expression of genes in the macromolecular catabolic processes (GO: 0009057). (F) Image cytometry analysis of airway neutrophils for IFIT3 (red) and phospho-IRF3 (green) expression. Nuclei were stained with DAPI (purple). Scale bars: 10 μm. (G) IFIT3 knockdown increased exocytosis of infectious SARS-CoV-2 in A2 neutrophils (n = 4 neutrophil donors). (H and I) IFIT3 knockdown modulates viral RNA catabolism (N1 and S RNA) in A2 neutrophils (n = 4 neutrophil donors). FFU, foci-forming units. Data are shown as median and interquartile range. Statistical analysis was performed using Wilcoxon’s matched-pair signed-rank test (A, B, and G–I) or 1-way ANOVA with Tukey’s test for multiple comparisons (C and D). *P < 0.05; **P < 0.01; ***P < 0.001. NS, not significant.

