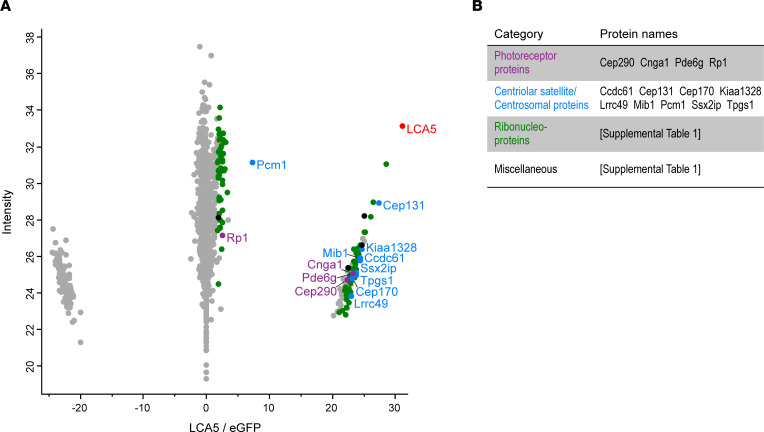
Figure 1. Identification and clustering of potential lebercilin interactors.
(A) Scatterplot showing enriched proteins, comparing AAV-LCA5–injected retinas to AAV-eGFP–injected (control) retinas in Lca5gt/gt (HOM) mice. The bait protein lebercilin (LCA5) is shown in red. Significantly enriched proteins (P < 0.05 by Student’s t test and FDR < 0.05 by significance A test) are categorized into different groups based on their function, including photoreceptor-associated proteins (purple), centriolar satellite/centrosomal proteins (blue), ribonucleoproteins (green), and miscellaneous (black). X axis represents log2 ratio between AAV-LCA5–injected and AAV-eGFP–injected (control) retinas. Y axis represents the intensity score, indicating the relative amounts of proteins in the data set. There were 15 mice per biological replicate (n = 5). (B) Table showing the significant proteins categorized in different groups, based on their function. Original data are listed in Supplemental Table 1.

