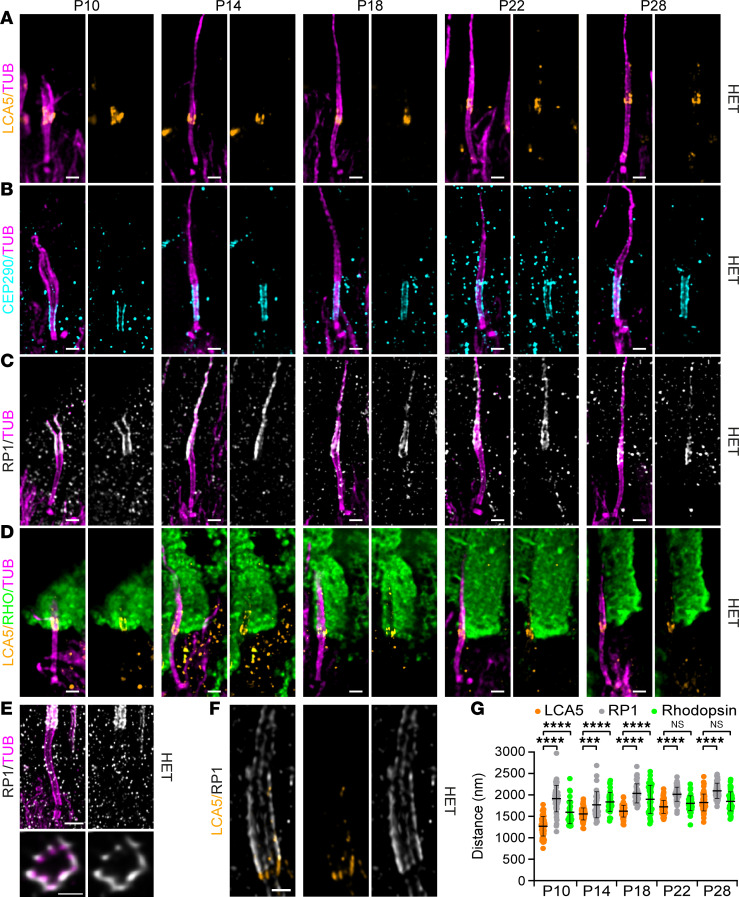
Figure 2. Nanoscale mapping of lebercilin.
(A–D) Widefield (original magnification, 63×) images of expanded photoreceptors stained for tubulin (magenta) and lebercilin (LCA5; orange, A), CEP290 (cyan, B), RP1 (white/gray, C), or LCA5/rhodopsin (orange/green, D) from P10 to P28 in Lca5+/gt (HET) mice. Scale bars: 500 nm. (E) Confocal U-ExM images of adult photoreceptor stained for tubulin (magenta) and RP1 (white/gray). Lower panels show transversal view of the bulge region. Scale bars: 500 nm (side view), 200 nm (transversal view). (F) Confocal U-ExM image of adult photoreceptor stained for LCA5 (orange) and RP1 (white/gray). Scale bar: 200 nm. (G) Quantification of the distance of LCA5 (orange), RP1 (white/gray), and rhodopsin (green) signal proximal ends to the mother centriole proximal end from P10 to P28. Three animals per time point. Data presented as mean ± SD; n = 35–80. ***P < 0.001, ****P < 0.0001 by Kruskal-Wallis test with Dunn’s multiple-comparison test.

