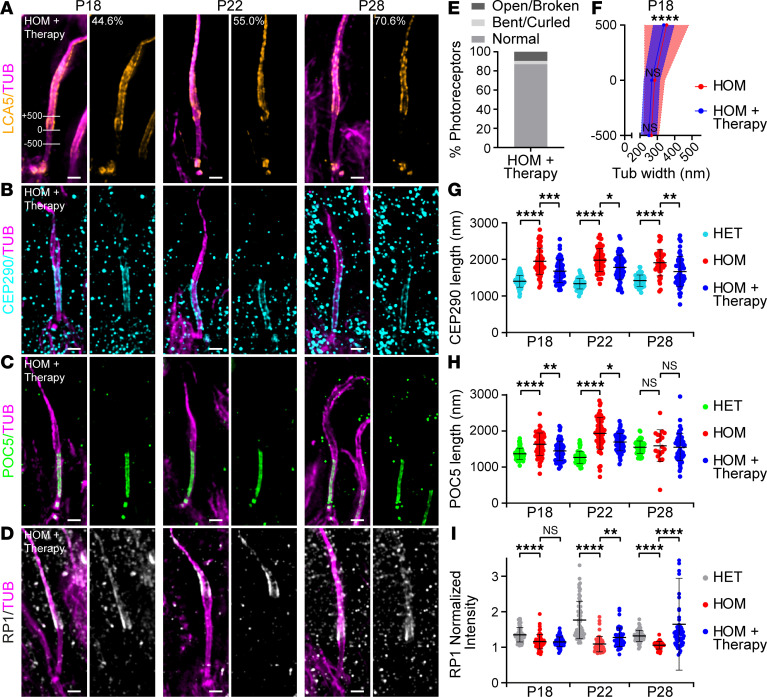
Figure 5. Effect of AAV-LCA5 gene augmentation therapy on distal axoneme organization and CC length.
(A–D) Widefield (original magnification, 63×) images of expanded photoreceptors stained for tubulin (magenta) and lebercilin (LCA5; orange, A), CEP290 (cyan, B), POC5 (green, C), or RP1 (white/gray, D) from P18 to P28 in AAV-LCA5 gene therapy–treated Lca5gt/gt mice (HOM + Therapy). Lines in P18 LCA5 image (A) illustrate measurements shown in F of tubulin width at 3 locations: +500 nm, 0 nm, −500 nm. The proximal end of the LCA5 signal was used to set the 0 location. A indicates the percentage of photoreceptors that express LCA5 at each time point (n = 109–184). Three animals per time point. Scale bars: 500 nm. (E) Distal axoneme (above CC) conformations of HOM + Therapy photoreceptors from P18 to P28 indicated in percentages. Photoreceptor distal axoneme conformations: normal (87%), open/broken (9.6%), and bent/curled (3.4%). n = 146. (F) Tubulin width measurements of P18 HOM photoreceptors, gene therapy treated versus nontreated, at the 3 locations depicted in A. Average tubulin width at each location is indicated by a red or blue dot for HOM and HOM + Therapy, respectively. Only photoreceptors that express LCA5 were used for the measurements. HOM measurements correspond to the data presented in Figure 3C. Three animals per time point. Data presented as mean ± SD; n = 27–37. ****P < 0.0001 by F test. Significance represents tubulin width dispersion between HOM and HOM + Therapy. (G–I) Impact of AAV-LCA5 gene therapy on CEP290 length (G), CC inner scaffold length (POC5, H), or RP1-normalized intensity at the bulge region (I) from P18 to P28. HET and HOM measurements correspond to the data in Figure 3, G–I. Three animals per time point. Data presented as mean ± SD; n = 39–65 (G), n = 19–60 (H), n = 39–62 (I). *P < 0.05, **P < 0.01, ***P < 0.001, ****P < 0.0001 by Kruskal-Wallis test with Dunn’s multiple-comparison test.

