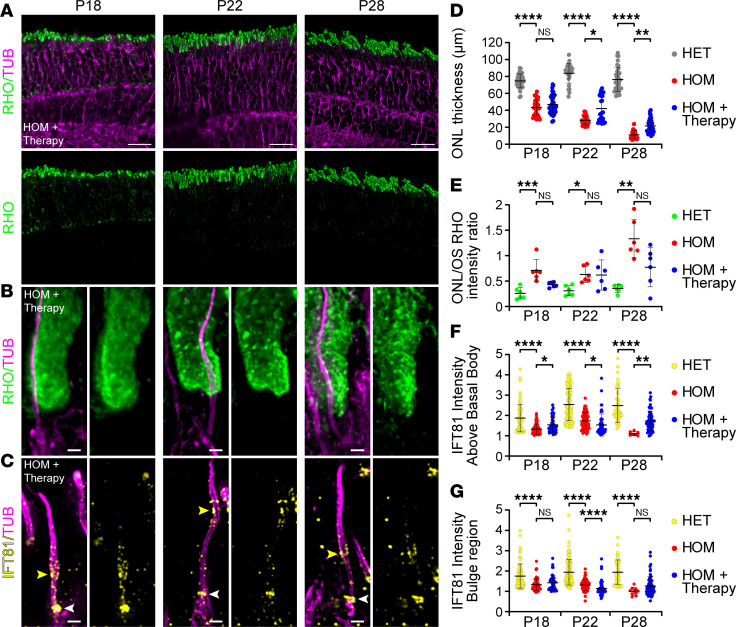
Figure 6. Effect of AAV-LCA5 gene augmentation therapy on OS formation and intraflagellar transport.
(A) Low-magnification (original magnification, 20×) widefield images of expanded Lca5gt/gt (HOM) retinas, treated with AAV-LCA5 gene therapy (HOM + Therapy), showing rod OS restoration from P18 to P28 by staining with rhodopsin (green) and tubulin (magenta). Scale bars: 20 μm. (B and C) Widefield (original magnification, 63×) images of expanded photoreceptors stained for tubulin (magenta) and rhodopsin (green, B) or IFT81 (yellow, C) from P18 to P28 in AAV-LCA5 gene therapy–treated HOM mice. White arrowheads in C indicate IFT81 localization above the basal body. Yellow arrowheads in C indicate IFT81 localization at the bulge region. Scale bars: 500 nm. (D–G) Impact of AAV-LCA5 gene therapy on outer nuclear layer (ONL) thickness (D), ONL/OS rhodopsin intensity ratio (E), IFT81-normalized intensity above the basal body (F), or IFT81-normalized intensity at the bulge region (G) from P18 to P28. Note that HET and HOM measurements in F and G correspond to data in Figure 4, F and G. Three animals per time point. Data presented as mean ± SD; n = 28–36 (D), n = 6 (E), n = 8–113 (F), n = 10–113 (G). *P < 0.05, **P < 0.01, ***P < 0.001, ****P < 0.0001 by Kruskal-Wallis test with Dunn’s multiple-comparison test.

