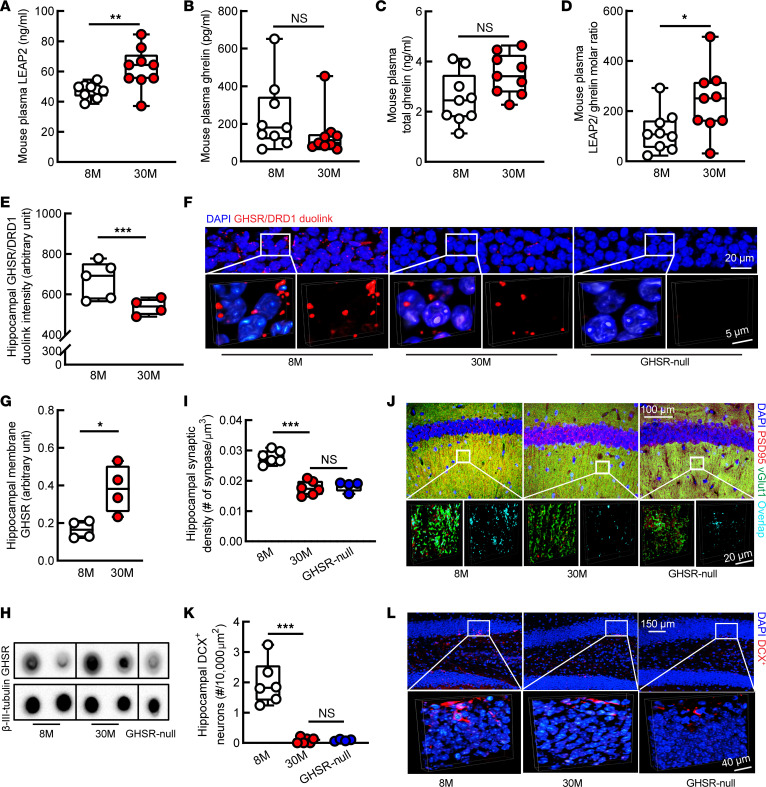
Figure 4. Hippocampal ghrelin signaling deregulation and pathology in old mice.
(A) Thirty-month-old (30M) mice showed increased plasma LEAP2 compared with 8M mice. (B and C) Plasma ghrelin (B) or total ghrelin (C) showed no change. (D) Plasma LEAP2/ghrelin molar ratio increased in 30M mice. (A–D) n = 9 mice per group. (E and F) Hippocampal GHSR/DRD1 heterodimerization by Duolink PLA assay. 8M, n = 5; 30M, n = 4; GHSR-null, n = 2. (F) Representative images. Scale bar: 20 μm (inset, scale bar: 5 μm). GHSR-null mice were used to verify Duolink PLA assay. (G and H) Hippocampal membrane–bound GHSR expression by membrane blot. β-III Tubulin was used as the loading control. 8M, n = 4; 30M, n = 4; GHSR-null, n = 2. (H) The representative images. GHSR-null mice were used to verify the specificity of membrane blot. The dots were run on the same membrane but were noncontiguous. (I and J) Synaptic density of hippocampal CA1 region was analyzed by colocalization of presynaptic marker (vGlut1) and postsynaptic marker (PSD95). 8M, n = 6; 30M, n = 6; GHSR-null, n = 4. (J) The 3D-reconstructed representative images. Scale bar: 100 μm (inset, scale bar: 20 μm). (K and L) The number of doublecortin+ (DCX+) neurons were counted in the dentate gyrus. 8M, n = 6; 30M, n = 6; GHSR-null, n = 4. (L) The 3D-reconstructed representative images. Adult neurogenesis was determined by DCX+ staining. Scale bar: 150 μm (inset, scale bar: 40 μm). GHSR-null, 8-month-old GHSR-null mice. Unpaired Student’s t test was used in A–E and G; 1-way ANOVA followed by Bonferroni post hoc analysis was used in I and K. *P < 0.05, **P < 0.01, ***P < 0.001. Sagittal brain slices that were 0.8–1 mm lateral to the medial plane were used in E and F, and slices 1–1.2 mm were used in I–L.

