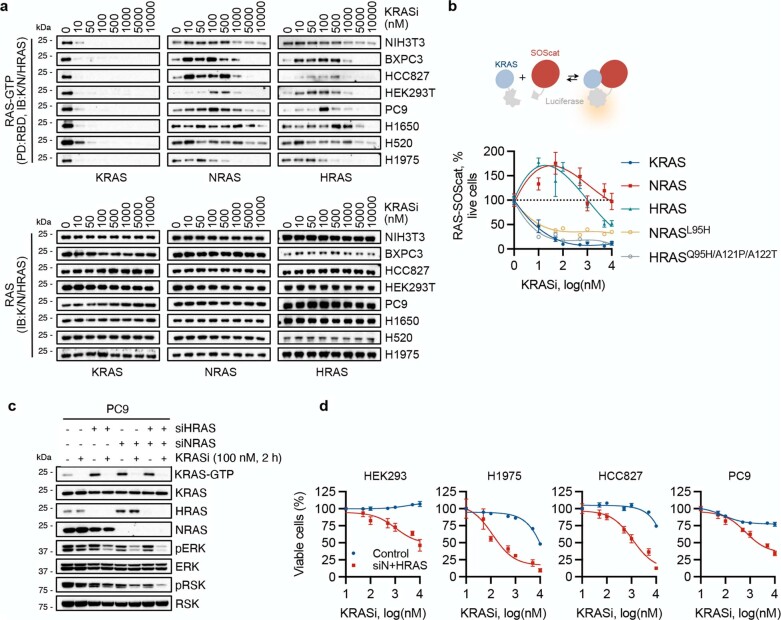
Extended Data Fig. 7. Drug induced cellular activation of HRAS and NRAS.
a, The indicated KRAS WT cells were treated for 2 h to determine the effect on RAS isoform activation. A representative of two independent repeats is shown. b, A split luciferase construct was used to determine the effect of treatment (2 h) on the interaction between RAS variants and the catalytic subunit of SOS1 (SOScat, mean ± s.e.m., n = 3). c, The cells were transfected with HRAS- and/or NRAS-specific siRNA pools and treated as shown. Extracts were analyzed to determine the level of KRAS activation and downstream signaling inhibition. A representative of two independent repeats is shown. d, The indicated KRAS WT models were transfected with NRAS- and HRAS-specific siRNA pools, followed by treatment with the KRASi for 72 h. The effect on cell viability was determined by the ATP-glow assay (mean ± s.e.m., n = 3).

