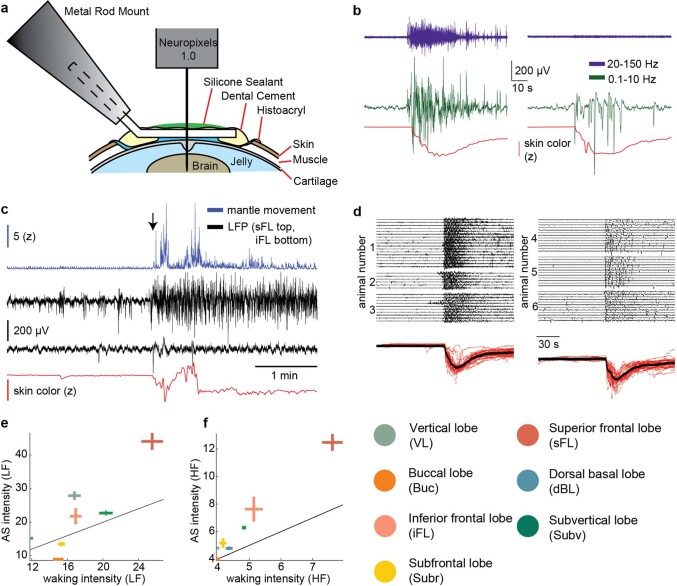
Extended Data Fig. 6. Neural correlates of active sleep.
a) Schematic of head fixation technique. b) LFP recordings from the sFL (left) and VL (right), as in Fig. 3b,c, filtered for low-frequency (LF) (0.1-10 Hz) and high-frequency (HF) (20-150 Hz) activity. c) Time around a sleep-wake transition (black arrow) demonstrating recording stability. Neural activity in the sFL (black, top) increases and mantle coloration (red) darkens upon waking. Activity in the iFL (black, bottom), remains quiet. There are two periods of transient large movements, which are not prominent in either LFP recording. d) LFP centred on AS start time (rows: different AS bouts), showing reliability in AS related LFP activity from sFL (left) and VL (right) across animals. e) Relationship between low-frequency (0.1-10 Hz) LFP activity strength during waking and AS. Crosses: mean ± 95% confidence interval for all electrodes located in a brain region. Line: Y = X. N = 583, 477, 85, 81, 84, 239, 395 electrodes from N = 8, 3, 3, 2, 3, 3, 6 animals for VL, sFL, iFL, Buc, Subr, dBL, Subv respectfully. f) As e) but for high-frequency (20-150 Hz) LFP activity strength.

