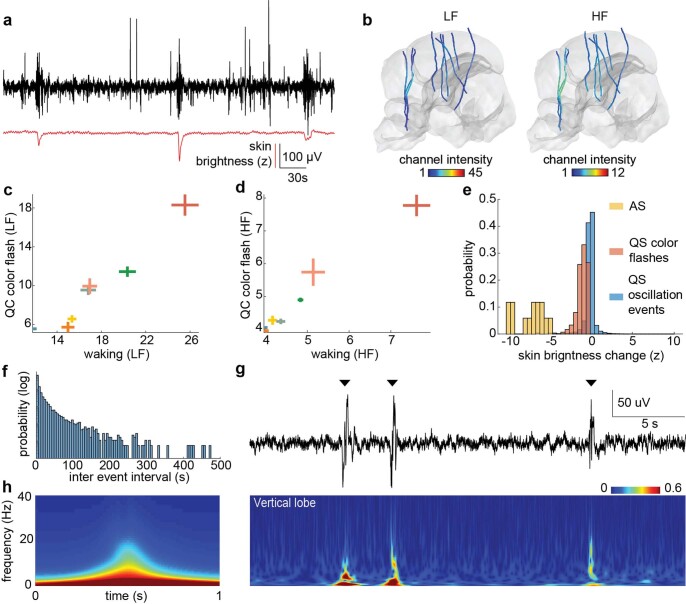
Extended Data Fig. 7. Neural correlates of quiet sleep.
a) Example LFP recording from the sFL and skin brightness trace during QS, showing increases in neural activity at times of QS colour flashes. b) low-frequency (LF) (0.1-10 Hz) and high-frequency (HF) (20-150 Hz) activity across recording electrodes during QS. Colour scales as in Fig. 3e–h. c) Relationship between low-frequency LFP activity strength during waking and QS colour flashes. Crosses correspond to the mean ± 95% confidence interval for all electrodes located in a brain region. Colours denote brain regions, as in Extended Data Fig. 6. N = 583, 477, 85, 81, 84, 239, 395 electrodes from N = 8, 3, 3, 2, 3, 3, 6 animals for VL, sFL, iFL, Buc, Subr, dBL, Subv respectfully. d) As d) but for high-frequency LFP activity strength. e) Distributions of the magnitude of skin brightness change for AS bouts, QS colour flashes, and QS oscillation events. f) QS oscillation event inter-event interval distribution. g) Top: Example LFP recording (filtered 0.5-150 Hz for display) from the anterior VL during QS, showing detected QS oscillatory events (arrowheads). Bottom: Spectrogram of above VL LFP recording (normalised 0-1, Methods). h) Average spectrogram over QS oscillatory events detected in the anterior VL (N = 2111, single recording, colour scale as in h).

