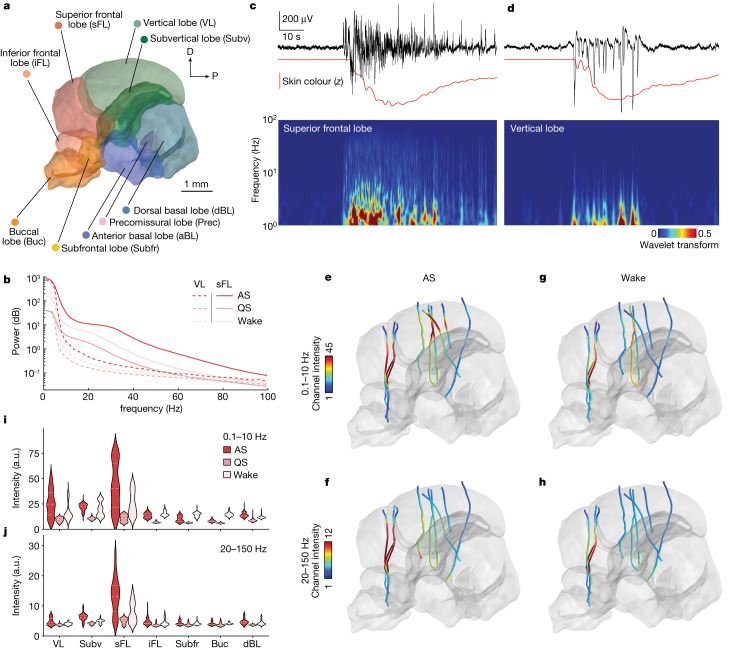
Fig. 3. Neural correlates of AS.
a, Atlas of the supra-oesophageal mass, onto which all Neuropixels recordings were mapped. b, LFP power spectrum during AS, QS and wake taken from sFL (solid lines) and VL (dashed lines). c,d, Representative LFP signals from sFL (c) and VL (d) at the onset of AS are shown as the top black lines. The red lines underneath represent mean skin brightness, showing the behavioural onset of AS. The bottom shows spectrograms of the corresponding LFP signals (normalized 0–1, Methods) e,f, LFP signal during AS. n = 9 Neuropixels recordings were mapped to the atlas. Each probe is coloured with the intensity of low (0.1–10 Hz) (e) and high (20–150 Hz) (f) frequency oscillations. g,h, LFP signal during the wake phase: low, 0.1–10 Hz (g) and high, 20–150 Hz (h). i,j, Violin plots showing the intensity of low- (i) and high- (j) frequency oscillations during AS, QS and wake phases. All channels from n = 9 probes were pooled together.

