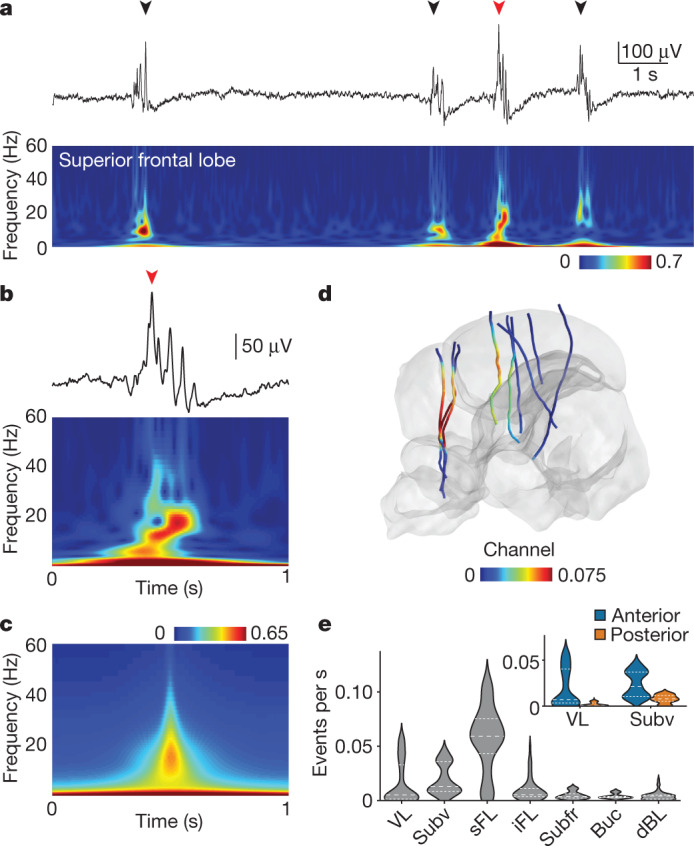
Fig. 4. Neural correlates of QS.

a, The top shows the LFP recorded in the sFL during QS, showing oscillatory events (arrow heads) and reduced activity relative to other behavioural states. The bottom shows a spectrogram of top LFP (normalized 0–1, Methods). b, Expanded view of burst in (a) (red arrow head). c, Average spectrogram of oscillatory events (n = 3,268, single recording). d, Oscillatory events during QS. n = 9 Neuropixels recordings were mapped to the atlas. Probe colour relates to the average oscillatory event rate. e, Violin plot showing the oscillatory event rate averaged over electrodes in each area. The inset shows that VL and Subv was divided anterior-posteriorly (Methods), showing higher oscillatory event rates anteriorly.
