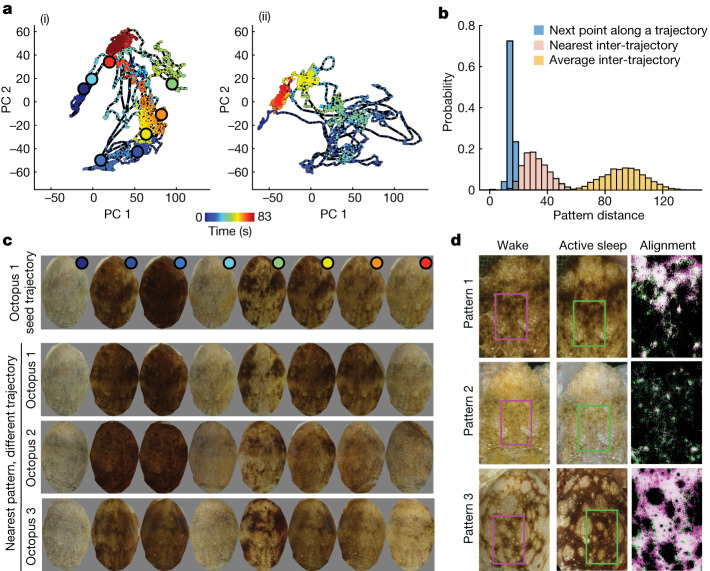
Fig. 5. Dynamics of AS skin patterning.
a, Two example AS bout trajectories ((i) and (ii)) projected onto the first two principal components of AS pattern space. Large dots in (i) show points sampled every 10 s from throughout the trajectory. b, Histograms showing distributions of pattern distances between (blue) nearest points in time along a trajectory, (pink) nearest points between trajectories, and (yellow) inter-trajectory distance at 0 time lag. Values are averages over AS bouts. c, The top row shows octopus 1 skin patterns at 10-s intervals along the trajectory in a (i). The bottom rows show nearest skin patterns to each image in the top seed trajectory, for other trajectories of octopus 1 and for other octopuses. d, Example pairs of similar waking and sleeping patterns. The right column shows non-linear alignment of rectangular regions in the left and middle columns, with brightness thresholded to show pattern match (white colour, Methods).

