
Fig. 3. MN bodies exhibit transcription defects and extensive DNA damage.
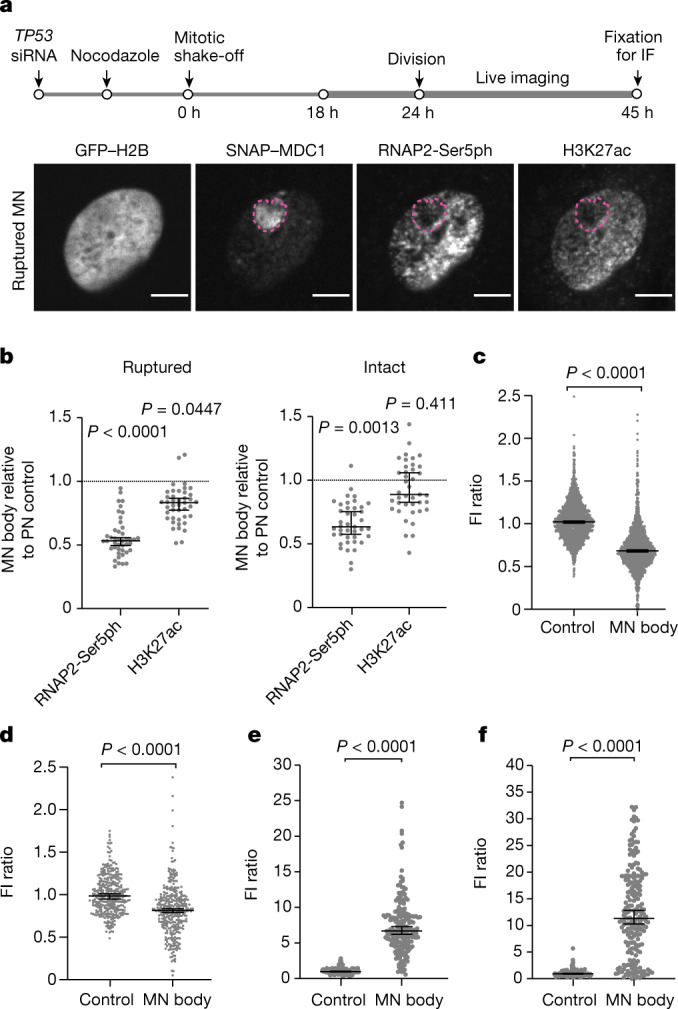
a, Defective transcription and H3K27ac in MN bodies. Top, scheme of the experiment (time points are approximate). IF, immunofluorescence imaging. Bottom, representative images of a daughter cell with a MN body from a ruptured micronucleus. Magenta dashed lines indicate a MN body with low RNAP2-Ser5ph and low H3K27ac levels. Scale bars, 5 µm. b, Aggregate data of relative MN body fluorescence intensities (FI) for RNAP2-Ser5ph and H3K27ac as in a (left to right, n = 43 and 41 from 8 experiments). Boxes are median with 95% CI; P values from two-tailed Mann–Whitney test comparing the FI ratio between MN and control PN region in the same cell. c, Decrease in RNAP2-Ser5ph in MN bodies verified by fixed imaging. Cells were fixed approximately 45 h after mitotic shake-off. MN bodies were identified on the basis of the endogenous MDC1 signal. Data points represent relative FI of RNAP2-Ser5ph in MN bodies against control regions (n = 1,447 from 12 experiments). Boxes are median with 95% CI; two-tailed Mann–Whitney test. d, Decrease in H3K27ac in MN bodies (n = 341 from 2 experiments). e, DNA damage in MN bodies. FI measurements of γH2AX intensity (94% of MN bodies were positive, >3 s.d. above the mean of the corresponding nuclear background; n = 195 from 2 experiments). f, 53BP1 accumulation within MN bodies as in e (82% of MN bodies were positive for 53BP1; n = 211, from two experiments). Analyses in d–f are similar to c.