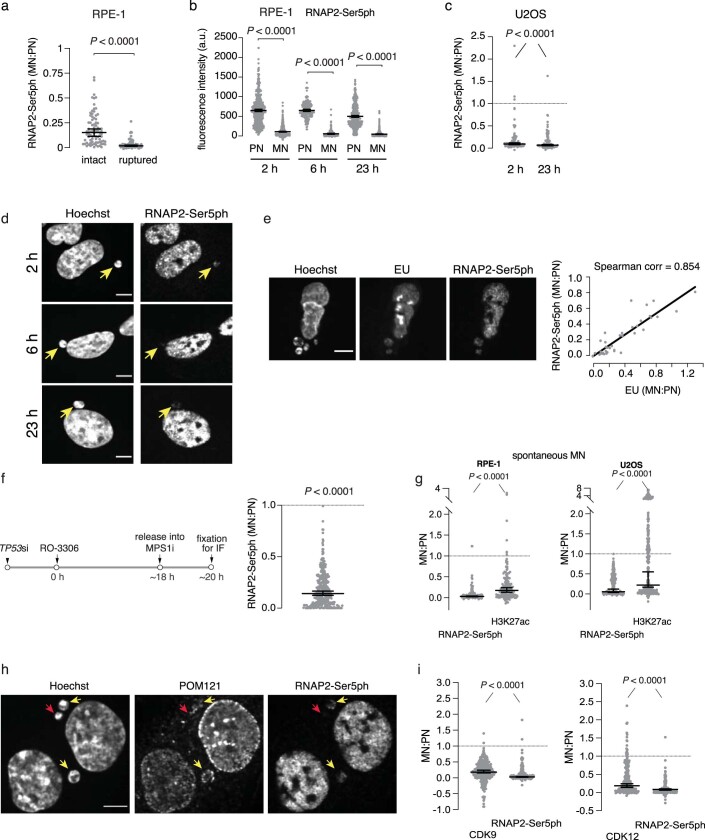
Extended Data Fig. 4. Transcription defects and chromatin modifications in newly formed (generation 1) micronuclei.
(a) Transcription is present at a reduced level in intact MN and is nearly absent in ruptured MN. Data points are background normalized MN:PN fluorescence intensity (FI) ratios of RNAP2-Ser5ph at 23 h post mitotic shake-off. RFP-NLS levels were used to assign the micronuclei in the two groups (n = 83 and 82, left to right, from three experiments). Micronuclei with NLS ratios below 0.1 relative to the PN were considered ruptured and above 0.3 were considered intact. Median with 95% confidence interval (CI); Two-tailed Mann–Whitney test. (b) Data from Fig. 1e, but instead of the MN:PN FI ratios what is shown here are the background normalized intensity values at 2, 6 and 23 h post release from nocodazole and mitotic shake-off (n = 644 for 2 h, 212 for 6 h and 605 for 23 h, from two or three experiments). Median with 95% CI; Kruskal-Wallis with Dunn’s multiple comparisons test. (c) In U2OS cells, active transcription (RNAP2-Ser5ph) is also reduced in newly formed MN. Performed and analyzed as in Fig. 1e (n = 88 and 104, left to right, from two experiments). (d) Representative images from the data shown in Fig. 1e. Yellow arrows indicate micronuclei. Scale bars 5 µm. (e) Independent confirmation of the MN transcription defect by 30 min EU pulse labeling. Left, representative images of S/G2 cells with MN (generation 1). Right, correlation between RNAP2-Ser5ph and EU levels. Cells with varying levels of RNAP2-Ser5ph intensity were selected and then EU intensity levels were measured (n = 37, from one experiment). Note the strong EU signal in the nucleoli which lack RNAP2-Ser5ph, because rDNA is transcribed primarily by RNA polymerase I and RNA polymerase III. Two-tailed Spearman’s correlation. Scale bar 5 µm. (f) MN transcription defects verified in MN generated by G2 arrest with CDK1 inhibition, followed by release into an MPS1 inhibitor. This synchronization and MN induction method differs from the nocodazole block and release protocol primarily used in this study because it shortens rather than lengthens mitosis (excluding hypothetical artifacts from prolonged mitotic arrest). Left: scheme of the experiment. RPE-1 cells were analyzed 2 h after release from the G2 block (n = 334, from three experiments). Right: quantification and analysis of the results as in Fig. 1e. (g) Transcription and chromatin defects in spontaneously generated micronuclei. Decreased levels of RNAP2-Ser5ph and H3K27ac in spontaneous micronuclei of untreated RPE-1 (left) and U2OS cells (right). Performed and analyzed as in Fig. 1e (n = 134 and 295, left to right, from two experiments). (h) Representative images from data shown in Fig. 1f. Yellow arrows indicate micronuclei with nucleoporin signal (POM121) and transcription (RNAP2-Ser5ph). In contrast, red arrows indicate a micronucleus with decreased nucleoporin signal and much lower transcription signal. Note that we evaluated the specificity of POM121 staining by confocal microscopy, showing the typical nuclear pore complex dot-like pattern at the nuclear surface and the increased rim signal at the nuclear periphery by imaging a focal plane in the middle of the cell. Scale bar 5 µm. (i) Reduced accumulation of CDK9 and CDK12 in the micronuclei. The levels of CDK9, CDK12 and RNAP2-Ser5ph were analyzed in micronuclei 23 h post release from a nocodazole block followed by a mitotic shake-off. The experiment was performed and analyzed as in Fig. 1e (n = 285 and 291, left to right, from two experiments). An analysis of intact micronuclei also showed the defective accumulation of both CDK9 and CDK12 (MN:PN ratios: 0.35 for CDK9 and 0.09 for RNAP2-Ser5ph; n = 111, P < 0.0001; 0.28 and 0.08 MN:PN for CDK12 and RNAP2-Ser5ph groups, respectively, n = 102, P < 0.0001; from two experiments).

