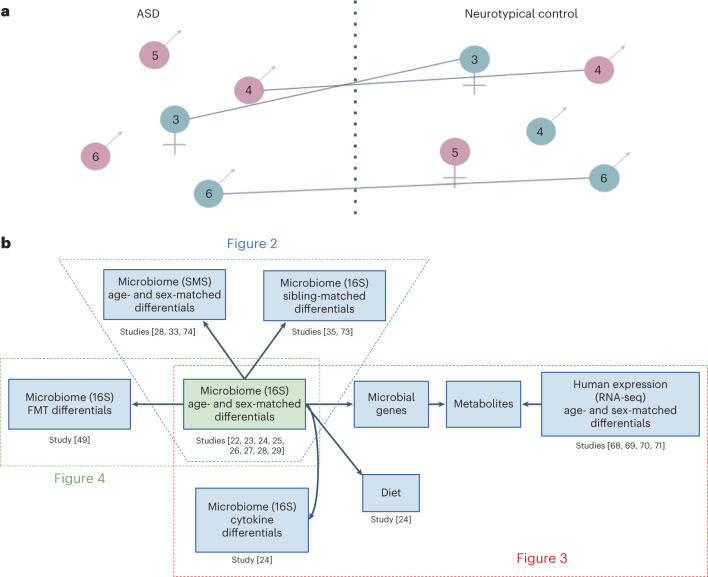
Fig. 1. Diagram delineating the concept of age matching and sex matching.
a, Children with ASD and neurotypical children of the same gender and similar age (±6 months) were matched within studies to reduce batch effects due to experimental and other cohort-specific differences. Matched pairs were then used to compute differentials (log fold ratios) of different omic features (microbes, metabolites, etc.). Downstream analyses across studies compared the within-study differentials determined for the different pairs of matched individuals (numbers inside circles denote age in years). b, The structure of our meta-analysis across multiple omic levels. For Fig. 2, 16S differentials computed from age-matched and sex-matched cohorts were cross-referenced against 16S differentials from sibling-matched cohorts as well as against SMS differentials from other age-matched and sex-matched cohorts. For Fig. 3, the 16S differentials from the age-matched and sex-matched cohorts were cross-referenced against cytokine differentials and RNA-seq differentials using KEGG pathways as a reference. Figure 3 also includes a microbe–diet co-occurrence analysis. For Fig. 4, the 16S differentials from the age-matched and sex-matched cohorts were cross-referenced against 16S differentials computed from the Kang et al. FMT trial52.

