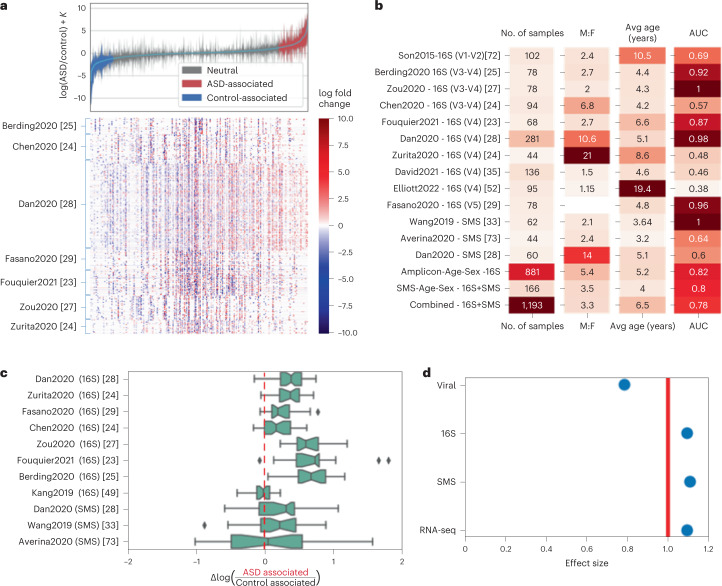
Fig. 2. Differential ranking analysis across omics levels.
a, Global microbial 16S log fold changes between age-matched and sex-matched ASD and control individuals. Error bars represent the 95% credible intervals. Heat map showing all center log ratio (CLR) transformed microbial differentials for each age-matched and sex-matched ASD–control pair across all cohorts. Microbes are binned into ASD-associated, Neutral and Control-associated groups using an age-matched and sex-matched classifier (Methods). K is an unknown bias due to the shift in the microbial load between the ASD and neurotypical control population. b, Sample size, male:female (M:F) ratio and average ages across all 16S and shotgun metagenomics datasets analyzed in this study and held-out gradient boosting ASD prediction performance measured by AUROC. V3–V4, V4 and V4–V5 refer to the variable region of the bacterial ribosomal RNA analyzed. c, Log ratios of microbes that are classified to be ASD associated and control associated were computed for each sample. The x axis represents the case–control differences of these log ratios, where values greater than 0 indicate that there is a separation between children with ASD and neurotypical children. The box plots show the median (line), 25–75% range (box) and 5–95% range (whiskers). d, Effect sizes of different omics levels: viral, 16S, SMS and RNA-seq.

